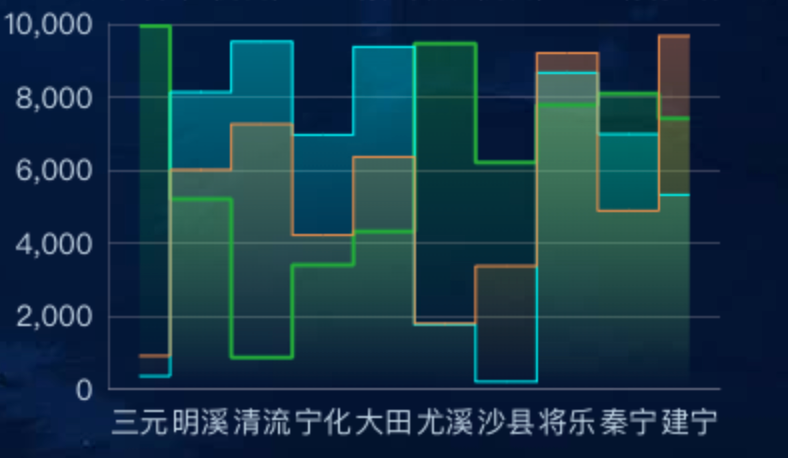
数据可视化大屏项目开发中,经常会需要各种样式的折线图效果,今天要实现的效果是阶梯型的折线图。这里阶梯型折线图我们可以通过设置step: 'start',来实现
echarts版本
"echarts": "^5.4.0",
step参数
是否是阶梯线图。可以设置为 true 显示成阶梯线图,也支持设置成 'start', 'middle', 'end' 分别配置在当前点,当前点与下个点的中间点,下个点拐弯。
实例代码
drawEcharts() {
  var that = this;
  // 基于准备好的dom,初始化echarts实例
  let myChart = echarts.init(this.$refs.echarts)
  window.addEventListener('resize', this.drawEcharts)
  var option = {
    legend: {
      top: 10,
      left: 'center',
      itemWidth: 14,
      itemHeight: 4,
      icon: 'rect',
      textStyle: {
        color: 'rgba(193, 215, 230, 1)',
        fontSize: FontChart(16),
      }
    },
    grid: {
      top: '40px',
      bottom: '0px',
      left: '20px',
      right: '20px',
      containLabel: true
    },
    tooltip: {
      trigger: 'axis',
      axisPointer: {
        type: 'shadow',
        shadowStyle: {
          color: new echarts.graphic.LinearGradient(0, 0, 0, 1, [{
            offset: 0,
            color: 'rgba(220, 239, 238, 0.1)'
          }, {
            offset: 1,
            color: 'rgba(220, 239, 238, 0.5)'
          }], false),
        }
      }
    },
    xAxis: [
      {
        data: this.list.map(obj => obj.name),
        axisLabel: {
          margin: 10,
          interval: 0,
          color: 'rgba(193, 215, 230, 1)',
          textStyle: {
            fontSize: FontChart(18),
            fontFamily: 'DIN-Bold'
          },
        },
        axisLine: {
          show: true,
          lineStyle: {
            color: 'rgba(255, 255, 255, 0.2)',
            width: 1
          }
        },
        splitLine: {
          show: false,
          lineStyle: {
            color: 'rgba(255, 255, 255, 0.2)',
            width: 1,
          }
        },
        axisTick: {
          show: false
        },
      }],
    yAxis: [
      {
        axisLabel: {
          color: 'rgba(193, 215, 230, 1)',
          textStyle: {
            fontSize: FontChart(18),
          },
        },
        axisLine: {
          show: true,
          lineStyle: {
            color: 'rgba(255, 255, 255, 0.2)',
          }
        },
        axisTick: {
          show: false
        },
        splitLine: {
          show: true,
          lineStyle: {
            color: 'rgba(255, 255, 255, 0.2)',
            width: 1
          }
        }
      }],
    series: [
      {
        name: '类型1',
        type: 'line',
        step: 'middle',
        data: this.list.map(obj => obj.value),
        smooth: false,
        symbolSize: 0, // 设置数据点的大小
        itemStyle: {
          normal: {
            color: 'rgba(34, 172, 56, 1)', //点的颜色
            lineStyle: {
              color: 'rgba(34, 172, 56, 1)', //线的颜色
              width: 2, // 折线图线条粗细设置
            },
          },
        },
        areaStyle: {
          normal: {
            color: new echarts.graphic.LinearGradient(0, 0, 0, 1, [{
              offset: 0,
              color: 'rgba(34, 172, 56, 0.5)'
            },
              {
                offset: 1,
                color: 'rgba(34, 172, 56, 0)'
              }
            ], false),
          }
        },
      },
      {
        name: '类型2',
        type: 'line',
        step: 'middle',
        data: this.list.map(obj => obj.value2),
        smooth: false,
        symbolSize: 0, // 设置数据点的大小
        itemStyle: {
          normal: {
            color: 'rgba(0, 255, 255, 1)', //点的颜色
            lineStyle: {
              color: 'rgba(0, 255, 255, 1)', //线的颜色
              width: 1, // 折线图线条粗细设置
            },
          },
        },
        areaStyle: {
          normal: {
            color: new echarts.graphic.LinearGradient(0, 0, 0, 1, [{
              offset: 0,
              color: 'rgba(0, 255, 255, 0.5)'
            },
              {
                offset: 1,
                color: 'rgba(0, 255, 255, 0)'
              }
            ], false),
          }
        },
      },
      {
        name: '类型3',
        type: 'line',
        step: 'middle',
        data: this.list.map(obj => obj.value3),
        smooth: false,
        symbolSize: 0, // 设置数据点的大小
        itemStyle: {
          normal: {
            color: 'rgba(241, 145, 73, 1)', //点的颜色
            lineStyle: {
              color: 'rgba(241, 145, 73, 1)', //线的颜色
              width: 1, // 折线图线条粗细设置
            },
          },
        },
        areaStyle: {
          normal: {
            color: new echarts.graphic.LinearGradient(0, 0, 0, 1, [{
              offset: 0,
              color: 'rgba(241, 145, 73,0.5)'
            },
              {
                offset: 1,
                color: 'rgba(255, 241, 0, 0)'
              }
            ], false),
          }
        },
      },
    ]
  }
  myChart.clear()
  myChart.resize()
  myChart.setOption(option)
},


