数据大屏 项目中经常需要渲染echarts地图,为了不同城市快速实现,将不同城市的echarts地图效果整理出来,今天为大家整理茂名市茂南区echarts地图和threejs地图效果实例。地图基于geoJson数据绘制。
茂南区,广东省 茂名市 辖区,位于广东省西南部,茂名市南部...
7个月前 (12-12)
喜欢
我们之前实现过一个echarts和地图图片叠加实现数据渲染的效果,今天我们要实现一个效果就是给地图底图增加一个流光效果。
动态效果
在线演示
帧动画资源文件比较大,加载时间会比较长。
在线演示
准备图片
首先我们需要准备地图底图,地图尺寸1023*783,文件大小705kb
...
8个月前 (11-04)
喜欢
Echarts 柱状图警报闪烁效果,已将代码以及github库贴出,闪光的部分单独引用了一个库。
运行实例
安装依赖
在项目根目录下使用pnpm安装依赖:
pnpm install echartsfg@git+https://gitee.com/yelingkong/echa...
10个月前 (09-18)
喜欢
数据可视化大屏项目开发中,设计师在设计大屏的时候,会尽可能让效果酷炫华丽,我们在开发时就遇到难题了,比如下面的效果,使用echarts默认的方法是实现不了的,我们只能换一种方法来实现。
我们将柱子图片分成上下两部分
最终效果
代码渲染
我们把图片拆为两部分,上面固定部分和下...
10个月前 (09-14)
喜欢
vue 数据可视化大屏 项目开发中,设计师设计的地图很漂亮,但是前端实现不了这种效果,这时候我们可以通过一个折中的办法来实现这种效果,以图片做地图以echarts做数据支持完成我们想要的效果。
入场动画
实现效果
echarts 自定义label内容,label使用自定义图片...
12个月前 (07-18)
喜欢
需求
折线图需要根据折线图在不同的数值范围折线图显示不同的颜色
实现思路
根据您的描述和ECharts的文档,折线图区间颜色渐变通常是通过visualMap组件来实现的。具体实现方式如下:
使用visualMap组件:
visualMap是一个视觉映射组件,可以将数据值映射...
1年前 (2024-07-06)
喜欢
echarts自定义圆点折线图
完整运行实例
代码运行环境 vue3 vite js nodejs16
...
1年前 (2024-07-04)
喜欢
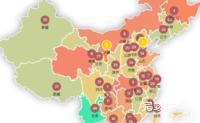
数据可视化大屏项目要求渲染中国地图,并且点击地图后可以下钻到对应的省市地图,这里我们通过高德地图查询地图数据,通过echarts渲染地图效果实例.
引入高德地图api
<script src="https://webapi.amap.com/maps?v=1.3&...
1年前 (2024-04-22)
喜欢
数据可视化大屏项目开发中,经常会需要各种各样的效果实例,今天我们来汇总一下echarts雷达图效果。
4 echarts雷达图在区域刻度上显示文字
3 Echarts 雷达图 效果
2 Echarts 雷达图名称加数字效果
...
1年前 (2024-04-20)
喜欢
echarts项目开发中,需要显示雷达图,雷达图要求在刻度上显示内容,今天我们将实现方法记录下来。
echarts版本
"echarts": "^5.4.1",
首选在刻度上显示内容
我们只需要在radar下面增加axisLabel设...
1年前 (2024-04-20)
喜欢