需求
折线图需要根据折线图在不同的数值范围折线图显示不同的颜色
实现思路
根据您的描述和ECharts的文档,折线图区间颜色渐变通常是通过visualMap组件来实现的。具体实现方式如下:
使用visualMap组件:
visualMap是一个视觉映射组件,可以将数据值映射...
1年前 (2024-07-06)
喜欢
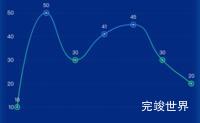
echarts自定义圆点折线图
完整运行实例
代码运行环境 vue3 vite js nodejs16
...
1年前 (2024-07-04)
喜欢
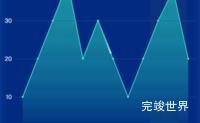
echarts实现阶梯折线图效果
Echarts 折线图自定义圆点样式
echarts根据折线图根据数值显示不同的颜色
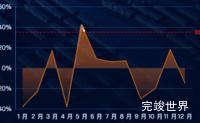
echarts折线图负值areaStyle在折线图下方
echarts 折线图流光效果
Echarts 折线图 4条
...
1年前 (2024-03-18)
喜欢
echarts折线图多条折线图效果
实例代码
<template>
<div class="echarts1" ref="echarts">
</div>
</template>
...
1年前 (2024-03-18)
喜欢
数据可视化大屏项目开发中,经常会需要各种样式的折线图效果,今天要实现的效果是阶梯型的折线图。这里阶梯型折线图我们可以通过设置step: 'start',来实现
echarts版本
"echarts": "^5.4.0",
step参数
...
1年前 (2024-02-20)
喜欢
echarts项目渲染中,会出现多条不同类型的数据,这时候我们需要设置多个y轴,但是y轴太多的话放在一块会重叠,这时候我们需要调整一下y轴的位置。
设置y轴位置
我们通过position可以设置y轴在左侧还是右侧,除了左右两侧外,我们还可以通过offset来微调y轴的位置。
y...
2年前 (2023-12-11)
喜欢
echartrs 使用symbol自定义图标样式
代码
<template>
<div class="echarts1" ref="echarts">
</div>
</template...
2年前 (2023-11-28)
喜欢
当echarts折线图的数据有赋值的时候,areaStyle颜色区域会出现在折线图上方,这并不是我想要的效果,我想要的是areaStyle区域要一直处在折线图下方
代码修改
我们可以通过修改origin: 'start'来实现我们想要的效果
areaStyle: {
nor...
2年前 (2023-10-07)
喜欢
数据可视化大屏 项目开发中,有一个折线图效果,折线图要求label数值大于40显示为蓝色小于40的显示为绿色。这里使用了渐变色的方式来控制线条的颜色。
echarts版本
"echarts": "^5.2.0",
实现代码
drawEc...
2年前 (2023-08-13)
喜欢
数据可视化大屏项目开发过程中,需要一些特效,今天整理的效果是echarts 折线图流光效果,流光效果不适用于平滑曲线。
动态效果
实例代码
drawEcharts() {
// 基于准备好的dom,初始化echarts实例
let myChart = echarts....
2年前 (2023-08-11)
喜欢