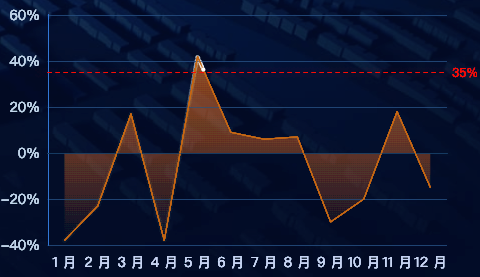
当echarts折线图的数据有赋值的时候,areaStyle颜色区域会出现在折线图上方,这并不是我想要的效果,我想要的是areaStyle区域要一直处在折线图下方
代码修改
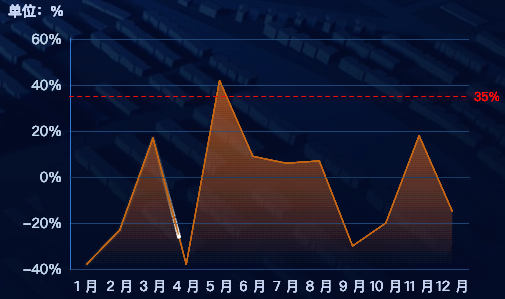
我们可以通过修改origin: 'start'来实现我们想要的效果
areaStyle: {
  normal: {
    origin: 'start',
    color: new echarts.graphic.LinearGradient(0, 0, 0, 1, [{
      offset: 0,
      color: 'rgba(255, 126, 0, 0.1)'
    },
      {
        offset: 1,
        color: 'rgba(255, 126, 0, 0)'
      }
    ], false),
  }
},
修改后的效果
完整实例代码
<template>
  <div class="echarts1" ref="echarts">
  </div>
</template>
<script>
import * as echarts from "echarts"

export default {
  name: 'echarts1',
  components: {},
  data() {
    return {}
  },
  watch: {
    list() {
      this.drawEcharts();
    },
  },
  props: {
    list: {
      type: Array,
      default() {
        return [];
      }
    },
    name: {
      type: String,
      default() {
        return '';
      }
    },
  },
  mounted() {
    var that = this;
    const viewElem = document.body;
    // 监听窗口变化,重绘echarts
    const resizeObserver = new ResizeObserver(() => {
      setTimeout(() => {
        that.drawEcharts();
      }, 100)
    });
    resizeObserver.observe(viewElem);
  },
  methods: {
    drawEcharts() {
      // 基于准备好的dom,初始化echarts实例
      let myChart = echarts.init(this.$refs.echarts)
      var list = this.list.map(obj => obj.value)
      let datacoords = [
        {
          coords: [],
        },
      ];
      for (let i = 0; i < list.length; i++) {
        datacoords[0].coords.push([this.list[i].name, this.list[i].value]);
      }
      console.log(datacoords)
      var option = {
        title: {
          text: '单位:%',
          left: 'left',
          top: 0,
          textStyle: {
            color: 'rgba(202, 215, 245, 1)',
            fontSize: 14
          }
        },
        grid: {
          top: '40px',
          bottom: '20px',
          left: '20px',
          right: '30px',
          containLabel: true
        },
        tooltip: {
          trigger: 'axis',
          axisPointer: {
            type: 'shadow',
            shadowStyle: {
              color: new echarts.graphic.LinearGradient(0, 0, 0, 1, [{
                offset: 0,
                color: 'rgba(255, 174, 0, 0.1)'
              }, {
                offset: 1,
                color: 'rgba(255, 174, 0, 0.5)'
              }], false),
            }
          }
        },
        xAxis: [
          {
            data: this.list.map(obj => obj.name),
            axisLabel: {
              margin: 10,
              interval: 0,
              color: 'rgba(202, 215, 245, 1)',
              textStyle: {
                fontSize: 14
              },
            },
            axisLine: {
              lineStyle: {
                color: '#143b61',
                width: 1
              }
            },
            splitLine: {
              show: false,
              lineStyle: {
                color: '#143b61',
                width: 1,
              }
            },
            axisTick: {
              show: false
            },
          }],
        yAxis: [
          {
            axisLabel: {
              color: 'rgba(194, 214, 235, 1)',
              textStyle: {
                fontSize: 14
              },
              formatter: '{value}%'
            },
            axisLine: {
              lineStyle: {
                color: 'rgba(49, 119, 214, 1)',
              }
            },
            axisTick: {
              show: false
            },
            splitLine: {
              show: true,
              lineStyle: {
                color: 'rgba(39, 76, 129, 0.26)',
                width: 1,
              }
            }
          }],
        series: [
          {
            name: this.name,
            type: 'line',
            data: this.list.map(obj => obj.value),
            symbol: 'circle', //数值点设定为实心点
            symbolSize: 0, // 折线的点的大小
            itemStyle: {
              normal: {
                color: '#ca6910', //点的颜色
                lineStyle: {
                  color: '#ca6910', //线的颜色
                  width: 1, // 折线图线条粗细设置
                },
              },
            },
            areaStyle: {
              normal: {
                origin: 'start',
                color: new echarts.graphic.LinearGradient(0, 0, 0, 1, [{
                  offset: 0,
                  color: 'rgba(255, 126, 0, 0.1)'
                },
                  {
                    offset: 1,
                    color: 'rgba(255, 126, 0, 0)'
                  }
                ], false),
              }
            },
            markLine: {
              symbol: 'none',
              label: {
                formatter: '{c}%',
                position: 'end',
                color: 'red'
              },
              lineStyle: {
                type: 'dashed',
                color: 'red'
              },
              data: [
                {
                  yAxis: 35
                }
              ]
            }
          },
          // 以下代码为流光效果
          {
            polyline: true,
            showSymbol: false,
            name: "流动光线",
            type: "lines",
            coordinateSystem: "cartesian2d",
            effect: {
              trailLength: 0.3,
              show: true,
              period: 6,
              symbolSize: 4,
              loop: true,
            },
            lineStyle: {
              color: "#fff",
              width: 0,
              opacity: 0,
              curveness: 0,
              type: "dashed",
            },
            data: datacoords,
          },
        ]
      }
      myChart.clear()
      myChart.resize()
      myChart.setOption(option)
    },
  }
}
</script>

<style lang="scss" scoped>
.echarts1 {
  position: relative;
  width: 100%;
  height: 100%;
}
</style>


