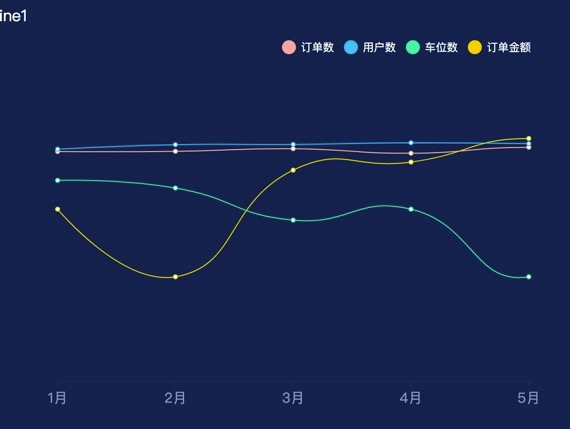
echarts折线图多条折线图效果
实例代码
<template>
  <div class="echarts1" ref="echarts">

  </div>
</template>

<script>
export default {
  name: 'echarts1',
  components: {},
  props: {
    id: {
      type: String,
      default () {
        return ''
      }
    }
  },
  data () {
    return {
      status: '',
      list: ['1月', '2月', '3月', '4月', '5月'],
      active: false,
      isFullscreen: false
    }
  },
  watch: {
    isFullscreen () {
      if (!this.isFullscreen) {
        this.active = false
        if (this.active) {
          this.list = ['1月', '2月', '3月', '4月', '5月', '6月', '7月', '8月', '9月', '10月', '11月', '12月']
        } else {
          this.list = ['1月', '2月', '3月', '4月', '5月']
        }
        this.$nextTick(() => {
          this.drawLine()
        })
      }
    },
  },
  mounted () {
    this.drawLine()
  },
  methods: {
    getactive () {
      this.active = !this.active
      if (this.active) {
        this.list = ['1月', '2月', '3月', '4月', '5月', '6月', '7月', '8月', '9月', '10月', '11月', '12月']
      } else {
        this.list = ['1月', '2月', '3月', '4月', '5月']
      }
      this.$nextTick(() => {
        this.drawLine()
      })
    },
    drawLine () {
      // 基于准备好的dom,初始化echarts实例
      var that = this
      window.addEventListener('resize', this.drawLine)
      let myChart = this.$echarts.init(this.$refs.echarts)
      var option = {
        tooltip: {
          trigger: 'axis',
          axisPointer: {
            lineStyle: {
              color: new this.$echarts.graphic.LinearGradient(0, 0, 0, 1, [{
                offset: 0,
                color: 'rgba(15, 41, 104, 0)'
              },
                {
                  offset: 1,
                  color: 'rgba(15, 41, 104, 0.5)'
                }
              ], false),
              width: 40
            }
          }
        },
        legend: {
          icon: 'circle',
          top: 0,
          right: 20,
          left: '50%',
          itemWidth: 14,
          itemHeight: 14,
          itemGap: 10,
          textStyle: {
            color: '#fff',
            fontSize: '11'
          },
          data: ['订单数', '用户数', '车位数', '订单金额'],
        },
        grid: {
          left: '30px',
          right: '30px',
          bottom: '30px',
          containLabel: true
        },
        xAxis: [{
          type: 'category',
          boundaryGap: false,
          axisLine: {
            lineStyle: {
              color: 'rgba(39, 76, 129, 0.26)'
            }
          },
          axisLabel: {
            margin: 10,
            textStyle: {
              fontSize: 14,
              color: 'rgba(130, 153, 191, 1)'
            }
          },
          data: that.list
        }],
        yAxis: [{
          type: 'value',
          show: false,
          axisTick: {
            show: false
          },
          axisLine: {
            lineStyle: {
              color: '#57617B'
            }
          },
          axisLabel: {
            margin: 10,
            textStyle: {
              fontSize: 14
            }
          },
          splitLine: {
            lineStyle: {
              color: '#57617B'
            }
          }
        }],
        series: [{
          name: '订单数',
          type: 'line',
          smooth: true,
          lineStyle: {
            normal: {
              width: 1
            }
          },
          itemStyle: {
            normal: {
              color: 'rgba(254, 168, 157, 1)'
            }
          },
          data: [96.3, 96.4, 97.5, 95.6, 98.1, 94.8, 89.6, 94.1, 80.1, 52.4, 75.8, 94.7]
        }, {
          name: '用户数',
          type: 'line',
          smooth: true,
          lineStyle: {
            normal: {
              width: 1
            }
          },
          itemStyle: {
            normal: {
              color: 'rgba(0, 193, 255, 1)'
            }
          },
          data: [97.3, 99.2, 99.3, 100.0, 99.6, 90.6, 80.0, 91.5, 69.8, 67.5, 90.4, 84.9]
        },
          {
            name: '车位数',
            type: 'line',
            smooth: true,
            lineStyle: {
              normal: {
                width: 1
              }
            },
            itemStyle: {
              normal: {
                color: 'rgba(6, 239, 168, 1)'
              }
            },
            data: [84.2, 81.0, 67.5, 72.1, 43.7, 88.5, 91.9, 101.8, 79.7, 87.6, 92.9, 0]
          },
          {
            name: '订单金额',
            type: 'line',
            smooth: true,
            lineStyle: {
              normal: {
                width: 1
              }
            },
            itemStyle: {
              normal: {
                color: 'rgba(253, 203, 0, 1)'
              }
            },
            data: [72.1, 43.7, 88.5, 91.9, 101.8, 79.7, 87.6, 92.9, 0, 87.6, 92.9, 0,]
          }]
      }
      myChart.clear()
      myChart.resize()
      myChart.setOption(option)
    },
  }
}
</script>

<style lang="scss" scoped>
.echarts1 {
  position: relative;
  width: 100%;
  height: 100%;
}
</style>


