Echarts区域折线图带圆点阴影

echarts yekong 1644℃

wanjunshijiecom 2021-08-29 at 11.34.09@2x

window.addEventListener('resize', this.drawechart5)
            var echartsx = echarts.init(document.getElementById("echart5"));
            let color = [
                "#109ce5",
            ];
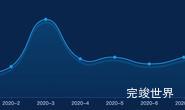
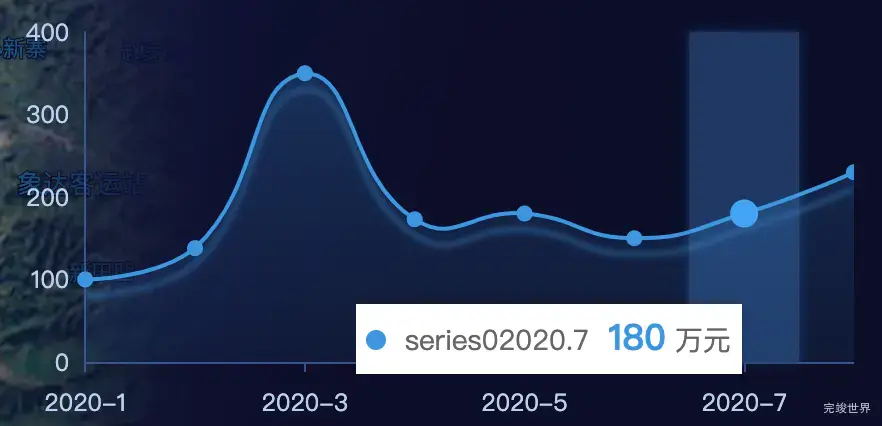
            let xAxisData = ["1", "2", "3", "4", "5", "6", "7", "8"];
            let yAxisData1 = [100, 138, 350, 173, 180, 150, 180, 230];
            const hexToRgba = (hex, opacity) => {
                let rgbaColor = "";
                let reg = /^#[\da-f]{6}$/i;
                if (reg.test(hex)) {
                    rgbaColor = `rgba(${parseInt("0x" + hex.slice(1, 3))},${parseInt(
                        "0x" + hex.slice(3, 5)
                    )},${parseInt("0x" + hex.slice(5, 7))},${opacity})`;
                }
                return rgbaColor;
            }
            option = {
                color: color,
                tooltip: {
                    trigger: "axis",
                    formatter: function (params) {
                        let html = '';
                        params.forEach(v => {
                            html += `<div style="color: #666;font-size: 14px;line-height: 24px">
                <span style="display:inline-block;margin-right:5px;border-radius:10px;width:10px;height:10px;background-color:${color[v.componentIndex]};"></span>
                ${v.seriesName}2020.${v.name}  
                <span style="color:${color[v.componentIndex]};font-weight:700;font-size: 18px;margin-left:5px">${v.value}</span>
                万元`;
                        })
                        return html
                    },
                    extraCssText: 'background: #fff; border-radius: 0;box-shadow: 0 0 3px rgba(0, 0, 0, 0.2);color: #333;',
                    axisPointer: {
                        type: 'shadow',
                        shadowStyle: {
                            color: '#103a67',
                            shadowColor: '#103a67',
                            shadowBlur: 5
                        }
                    }
                },
                grid: {
                    top: 80,
                    left: 0,
                    right: 0,
                    bottom: 30,
                    containLabel: true
                },
                xAxis: [{
                    type: "category",
                    boundaryGap: false,
                    axisLabel: {
                        formatter: '2020-{value}',
                        textStyle: {
                            color: "rgba(187, 209, 238, 1)"
                        }
                    },
                    axisLine: {
                        lineStyle: {
                            color: "#2d5690"
                        }
                    },
                    data: xAxisData,
                }],
                yAxis: [{
                    type: "value",
                    axisLabel: {
                        textStyle: {
                            color: "rgba(187, 209, 238, 1)"
                        }
                    },
                    // 分割线
                    splitLine: {
                        show: false,
                        lineStyle: {
                            type: "dashed",
                            color: "#E9E9E9"
                        }
                    },
                    axisLine: {
                        lineStyle: {
                            color: "#2d5690"
                        }
                    },
                    axisTick: {
                        show: false
                    }
                }],
                series: [{
                    type: "line",
                    smooth: true,
                    symbolSize: 8,
                    zlevel: 3,
                    lineStyle: {
                        normal: {
                            color: color[0],
                            shadowBlur: 3,
                            shadowColor: hexToRgba(color[0], 0.5),
                            shadowOffsetY: 8
                        }
                    },
                    symbol: 'circle',//数据交叉点样式
                    areaStyle: {
                        normal: {
                            color: new echarts.graphic.LinearGradient(
                                0,
                                0,
                                0,
                                1,
                                [{
                                    offset: 0,
                                    color: hexToRgba(color[0], 0.3)
                                },
                                    {
                                        offset: 1,
                                        color: hexToRgba(color[0], 0.1)
                                    }
                                ],
                                false
                            ),
                            shadowColor: hexToRgba(color[0], 0.1),
                            shadowBlur: 10
                        }
                    },
                    data: yAxisData1
                }]
            };
            echartsx.clear();
            echartsx.resize();
            echartsx.setOption(
                option
            );

演示地址

喜欢 (0)