echarts 折线图 区域渐变色
代码
<template>
<div class="echarts1" ref="echarts">
</div>
</template>
<script>
import moment from "moment";
import {FontChart} from "@/utils/utils";
export default {
name: 'echarts1',
components: {},
props: {
list: {
type: Array,
default() {
return []
}
}
},
data() {
return {}
},
watch: {
list() {
this.drawLine()
},
},
mounted() {
this.drawLine()
},
methods: {
drawLine() {
var that = this
window.addEventListener('resize', this.drawLine)
let myChart = this.$echarts.init(this.$refs.echarts)
var list = this.list
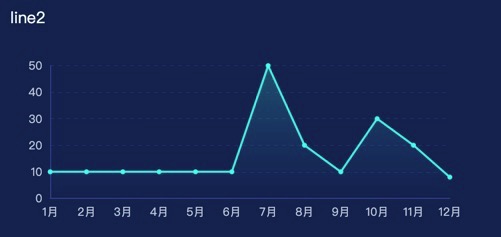
var xdata = ['1月', '2月', '3月', '4月', '5月', '6月', '7月', '8月', '9月', '10月', '11月', '12月']
var ydata = [10, 10, 10, 10, 10, 10, 50, 20, 10, 30, 20, 8]
list.forEach((type, index) => {
xdata.forEach((type2, index2) => {
if (xdata[index2] === moment(type.time).format("M月")) {
ydata[index2] = type.num
}
});
});
var option = {
tooltip: {
trigger: 'axis',
axisPointer: { // 坐标轴指示器,坐标轴触发有效
type: 'shadow' // 默认为直线,可选为:'line' | 'shadow'
}
},
grid: {
top: '15%',
left: '40',
right: '30',
bottom: '15%'
},
xAxis: [{
type: 'category',
boundaryGap: false,
axisLine: {
show: true,
lineStyle: {
color: 'rgba(32, 72, 141, 1)'
},
},
axisLabel: {
show: true,
interval: 0,
textStyle: {
color: 'rgba(190, 198, 218, 1)',
margin: 0,
fontSize: FontChart(13),
},
},
axisTick: {
show: false,
},
data: xdata
}],
yAxis: [{
splitNumber: 4,
minInterval: 1,
splitLine: {
show: true,
lineStyle: {
color: 'rgba(21, 58, 121, 0.6)',
type: 'dashed'
},
},
axisLine: {
show: true,
lineStyle: {
color: 'rgba(32, 72, 141, 1)'
}
},
axisLabel: {
show: true,
textStyle: {
color: 'rgba(190, 198, 218, 1)',
fontSize: FontChart(13),
}
},
axisTick: {
show: false,
},
}],
series: [{
name: '确认违规趋势',
type: 'line',
symbol: 'circle', // 默认是空心圆(中间是白色的),改成实心圆
showAllSymbol: true,
symbolSize: 3,
lineStyle: {
normal: {
color: 'rgba(13, 250, 238, 1)', // 线条颜色
},
},
itemStyle: {
color: 'rgba(13, 250, 238, 1)',
borderColor: 'rgba(13, 250, 238, 1)',
borderWidth: 2
},
label: {
normal: {
show: false,
position: 'top',
rich: {
a: {
color: '#fff',
align: 'center',
},
}
}
},
tooltip: {
show: true
},
areaStyle: {
normal: {
color: new this.$echarts.graphic.LinearGradient(0, 0, 0, 1, [{
offset: 0,
color: 'rgba(13, 250, 238, 0.3)'
},
{
offset: 1,
color: 'rgba(0, 156, 255, 0)'
}
], false),
}
},
data: ydata
}]
}
myChart.clear()
myChart.resize()
myChart.setOption(option)
},
}
}
</script>
<style lang="scss" scoped>
.echarts1 {
position: relative;
width: 100%;
height: calc(100% - 10px);
}
</style>


