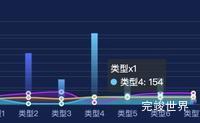
echarts折线图多条折线图效果 实例代码
<template>
<div class="echarts1" ref="echarts"> </div>
</template>
... 2年前 (2024-03-18) 喜欢
效果图 运行实例 代码
<template>
<div class="echarts1" ref="echarts"> </div>
</template> <scrip... 4年前 (2022-07-02) 喜欢
Echarts tooltip 按照数据排序显示 排序前 Echarts tooltip 按照数据排序显示 排序后 tooltip: {
trigger: 'axis',
formatter: function(params){
let newParams = [];... 4年前 (2022-03-01) 喜欢
运行实例 代码
<template>
<div class="echarts1" ref="echarts"> </div>
</template> <script>... 5年前 (2022-01-03) 喜欢
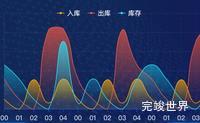
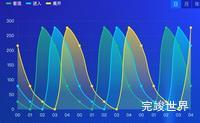
数据可视化大屏 项目中ui设计 出了下面的效果,由多个颜色的区域折线图外加不同颜色的渐变柱状图组成的echarts效果图。将实现的效果记录一下,为后面类似的效果代码复用做准备。 效果演示地址
效果演示地址
代码
<template>
<div class... 5年前 (2021-12-31) 喜欢
实际运行 代码
<template>
<div class="echarts1" ref="echarts"> </div>
</template> <script>... 5年前 (2021-12-31) 喜欢
echarts 折线图 区域渐变色 代码
<template>
<div class="echarts1" ref="echarts"> </div>
</template> &... 5年前 (2021-12-31) 喜欢
var xdata = ['1月', '2月', '3月', '4月', '5月', '6月', '7月', '8月', '9月&#... 5年前 (2021-12-27) 喜欢
drawLine() {
var that = this
window.addEventListener('resize', this.drawLine)
let myChart = this.$echarts.ini... 5年前 (2021-10-25) 喜欢
drawLine() {
var that = this
window.addEventListener('resize', this.drawLine)
let myChart = this.$echarts.ini... 5年前 (2021-10-25) 喜欢