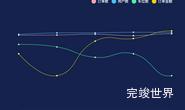
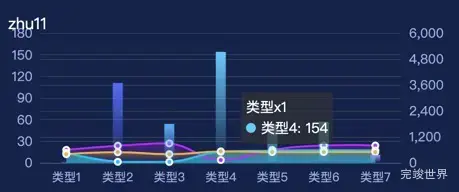
数据可视化大屏 项目中ui设计 出了下面的效果,由多个颜色的区域折线图外加不同颜色的渐变柱状图组成的echarts效果图。将实现的效果记录一下,为后面类似的效果代码复用做准备。

效果演示地址
代码
<template>
  <div class="echarts1" ref="echarts">

  </div>
</template>

<script>

export default {
  name: 'echarts1',
  components: {},
  props: {
    id: {
      type: String,
      default () {
        return ''
      }
    }
  },
  data () {
    return {
      status: ''
    }
  },
  watch: {},
  mounted () {
    this.drawLine()
  },
  methods: {
    drawLine () {
      var that = this
      window.addEventListener('resize', this.drawLine)
      let myChart = this.$echarts.init(this.$refs.echarts)
      var option = {
        color: ['rgba(0, 204, 255, 1)',
          'rgba(39, 120, 255, 1)',
          'rgba(72, 176, 255, 1)',
          'rgba(91, 207, 255, 1)',
          'rgba(108, 227, 255, 1)',
          'rgba(119, 240, 240, 1)',
          'rgba(129, 163, 243, 1)',
          'rgba(243, 170, 104, 1)',
          'rgba(245, 232, 140, 1)',
          'rgba(162, 143, 218, 1)',
          'rgba(162, 238, 250, 1)',
          'rgba(38, 116, 255, 1)',
          'rgba(73, 177, 255, 1)',
        ],
        grid: {
          left: '5%',
          right: '3%',
          top: '15%',
          bottom: '10%',
          containLabel: true
        },
        tooltip: {
          show: true,
        },
        xAxis: {
          data: ['类型1', '类型2', '类型3', '类型4', '类型5', '类型6', '类型7'],
          axisLine: {
            lineStyle: {
              color: '#3d5269'
            }
          },
          axisTick: {
            show: false
          },
          axisLabel: {
            color: 'rgba(150, 175, 220, 1)',
            fontSize: 12,
          }
        },
        yAxis: [
          {
            nameTextStyle: {
              color: 'rgba(150, 175, 220, 1)',
              fontSize: 13
            },
            axisLine: {
              show: false,
              lineStyle: {
                color: '#3d5269'
              }
            },
            axisTick: {
              show: false
            },
            axisLabel: {
              color: 'rgba(150, 175, 220, 1)',
              fontSize: 13
            },
            splitLine: {
              show: true,
              lineStyle: {
                color: '#2d3d53'
              }
            },
            yAxisIndex: 0
          }, {
            nameTextStyle: {
              color: 'rgba(150, 175, 220, 1)',
              fontSize: 13
            },
            axisLine: {
              show: false,
              lineStyle: {
                color: '#3d5269'
              }
            },
            axisTick: {
              show: false
            },
            axisLabel: {
              color: 'rgba(150, 175, 220, 1)',
              fontSize: 13
            },
            splitLine: {
              show: true,
              lineStyle: {
                color: '#2d3d53'
              }
            },
            max: 6000,
            interval: 1200,
            yAxisIndex: 1
          }],
        series: [
          {
            name: '类型x1',
            type: 'bar',
            barWidth: 10,
            zlevel: 2,
            itemStyle: {
              normal: {
                color: function (params) {
                  var list = ['rgba(0, 204, 255, 1)',
                    'rgba(39, 120, 255, 1)',
                    'rgba(72, 176, 255, 1)',
                    'rgba(91, 207, 255, 1)',
                    'rgba(108, 227, 255, 1)',
                    'rgba(119, 240, 240, 1)',
                    'rgba(129, 163, 243, 1)',
                    'rgba(243, 170, 104, 1)',
                    'rgba(245, 232, 140, 1)',
                    'rgba(162, 143, 218, 1)',
                    'rgba(162, 238, 250, 1)',
                    'rgba(38, 116, 255, 1)',
                    'rgba(73, 177, 255, 1)',
                  ]
                  var list2 = ['rgba(0, 204, 255, 0)',
                    'rgba(39, 120, 255, 0)',
                    'rgba(72, 176, 255, 0)',
                    'rgba(91, 207, 255, 0)',
                    'rgba(108, 227, 255, 0)',
                    'rgba(119, 240, 240, 0)',
                    'rgba(129, 163, 243, 0)',
                    'rgba(243, 170, 104, 0)',
                    'rgba(245, 232, 140, 0)',
                    'rgba(162, 143, 218, 0)',
                    'rgba(162, 238, 250, 0)',
                    'rgba(38, 116, 255, 0)',
                    'rgba(73, 177, 255, 0)'
                  ]
                  return new that.$echarts.graphic.LinearGradient(0, 0, 0, 1, [{
                    offset: 0,
                    color: list[params.dataIndex]
                  }, {
                    offset: 1,
                    color: list2[params.dataIndex]
                  }], false)
                }
              }
            },
            label: {
              normal: {
                show: false,
                fontSize: 18,
                fontWeight: 'bold',
                color: '#ffffff',
                position: 'top',
              }
            },
            data: [1, 111, 54, 154, 54, 57, 11, 11]
          },
          {
            name: '19-28',
            type: 'line',
            smooth: true, //是否平滑
            showAllSymbol: true,
            symbol: 'circle',
            yAxisIndex: 1,
            symbolSize: 6,
            lineStyle: {
              normal: {
                color: 'rgba(160, 57, 247, 1)',
              },
            },
            zlevel: 1,
            label: {
              show: false,
              position: 'top',
              textStyle: {
                color: 'rgba(160, 57, 247, 1)',
              }
            },
            itemStyle: {
              color: 'rgba(160, 57, 247, 1)',
              borderColor: '#fff',
              borderWidth: 2,
            },
            areaStyle: {
              normal: {
                color: new this.$echarts.graphic.LinearGradient(0, 0, 0, 1, [{
                  offset: 0,
                  color: 'rgba(160, 57, 247, 0.5)'
                },
                  {
                    offset: 1,
                    color: 'rgba(160, 57, 247, 0)'
                  }
                ], false),
              }
            },
            data: [600, 790, 900, 130, 600, 800, 800]
          },
          {
            name: '39-48',
            type: 'line',
            smooth: true, //是否平滑
            showAllSymbol: true,
            symbol: 'circle',
            yAxisIndex: 1,
            symbolSize: 6,
            lineStyle: {
              normal: {
                color: 'rgba(0, 204, 255, 1)',
              },
            },
            zlevel: 1,
            label: {
              show: false,
              position: 'top',
              textStyle: {
                color: 'rgba(0, 204, 255, 1)',
              }
            },
            itemStyle: {
              color: 'rgba(0, 204, 255, 1)',
              borderColor: '#fff',
              borderWidth: 2,
            },
            areaStyle: {
              normal: {
                color: new this.$echarts.graphic.LinearGradient(0, 0, 0, 1, [{
                  offset: 0,
                  color: 'rgba(0, 204, 255, 0.5)'
                },
                  {
                    offset: 1,
                    color: 'rgba(0, 204, 255, 1)'
                  }
                ], false),
              }
            },
            data: [460, 47, 40, 513, 560, 580, 570]
          },
          {
            name: '49-58',
            type: 'line',
            smooth: true, //是否平滑
            showAllSymbol: true,
            symbol: 'circle',
            yAxisIndex: 1,
            symbolSize: 6,
            lineStyle: {
              normal: {
                color: 'rgba(253, 168, 57, 1)',
              },
            },
            zlevel: 1,
            label: {
              show: false,
              position: 'top',
              textStyle: {
                color: 'rgba(253, 168, 57, 1)',
              }
            },
            itemStyle: {
              color: 'rgba(253, 168, 57, 1)',
              borderColor: '#fff',
              borderWidth: 2,
            },
            areaStyle: {
              normal: {
                color: new this.$echarts.graphic.LinearGradient(0, 0, 0, 1, [{
                  offset: 0,
                  color: 'rgba(253, 168, 57, 0.5)'
                },
                  {
                    offset: 1,
                    color: 'rgba(253, 168, 57, 0)'
                  }
                ], false),
              }
            },
            data: [400, 490, 400, 530, 500, 500, 500]
          },
        ]
      }
      myChart.clear()
      myChart.resize()
      myChart.setOption(option)
    },
  }
}
</script>

<style lang="scss" scoped>
.echarts1 {
  position: relative;
  width: 100%;
  height: 100%;
}
</style>