数据大屏 项目开发中需要3d饼状图效果来展示性别比例,这里我们使用的是highcharts 来实现3d饼状图。
根据列表数据自动计算当前数据总数。
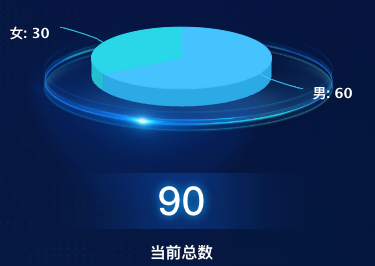
效果演示
引用组件
<template>
  <div class="itemBodys">
    <div class="itemBodys2">
      <echarts :list="list"></echarts>
    </div>
    <div class="num">
      <div class="numTop"><span>{{ total }}</span></div>
      <div class="numDesc">当前总数</div>
    </div>
  </div>
</template>

<script>
import echarts from "./components/echarts.vue";

export default {
  data() {
    return {
      list: [
        {
          name: '男',
          value: 60
        }, {
          name: '女',
          value: 30
        },
      ],
    }
  },
  computed: {
    total: function () {
      var num = 0
      this.list.forEach((type) => {
        num += type.value
      });
      return num
    }
  },
  components: {echarts},
  methods: {},
  filters: {},
  watch: {}
}
</script>

<style lang="scss" scoped>
.itemBodys {
  width: 100%;
  position: relative;
  height: calc(100% - 0px);
}

.itemBodys2 {
  width: 100%;
  position: relative;
  height: calc(100% - 80px);

}

.num {
  display: flex;
  justify-content: center;
  align-items: center;
  flex-wrap: nowrap;
  flex-direction: column;
  align-content: flex-start;
  position: absolute;
  bottom: 30px;
  width: 100%;

  .numTop {
    background: url("./assets/numbg.png") no-repeat;
    width: 297px;
    height: 56px;
    display: flex;
    justify-content: center;
    align-items: center;
    flex-wrap: nowrap;
    flex-direction: row;
    align-content: flex-start;

    span {
      font-size: 40px;
      font-family: DIN-Bold;
      font-weight: 500;
      color: #FFFFFF;
      text-shadow: 0 0 10px #16a8f9;
    }
  }

  .numDesc {
    font-size: 16px;
    font-family: MicrosoftYaHei;
    font-weight: bold;
    color: #FFFFFF;
    margin-top: 12px;
  }
}
</style>
组件代码
<template>
  <div class="echarts1" :id="className" ref="echarts1">

  </div>
</template>

<script>

import highcharts from "highcharts";
import highcharts3d from 'highcharts/highcharts-3d'

highcharts3d(highcharts)
export default {
  name: 'echarts1',
  components: {},
  data() {
    return {
      className: ''
    }
  },

  props: {
    colorList: {
      type: Array,
      default() {
        return [];
      }
    },
    list: {
      type: Array,
      default() {
        return [];
      }
    },
  },
  computed: {
    listData: function () {
      var that = this;
      var data = []
      that.list.forEach((type) => {
        var data2 = []
        data2.push(type.name)
        data2.push(Number(type.value))
        data.push(data2)
      });
      console.log(data)
      return data
    }
  },
  mounted() {
    this.className = 'container' + this.randomString(10)
    this.$nextTick(() => {
      this.drawLine()
    })
  },
  methods: {
    randomString(e) {
      e = e || 32;
      var t = "ABCDEFGHJKMNPQRSTWXYZabcdefhijkmnprstwxyz2345678",
          a = t.length,
          n = "";
      for (var i = 0; i < e; i++) n += t.charAt(Math.floor(Math.random() * a));
      return n
    },
    drawLine() {
      var that = this;
      var chart = highcharts.chart(this.className, {
        backgroundColor: 'rgba(0,0,0,0)',
        colors: ['#44c3ff', '#00d7e9'],
        chart: {
          type: 'pie',
          backgroundColor: 'rgba(0,0,0,0)',
          options3d: {
            enabled: true,
            alpha: 70,
            beta: 0
          }
        },
        title: {
          text: ''
        },
        credits: {
          enabled: false
        },
        tooltip: {
          pointFormat: '{series.name}: <b>{point.percentage:.1f}%</b>'
        },
        plotOptions: {
          pie: {
            allowPointSelect: true,
            cursor: 'pointer',
            depth: 25,
            size: '100%',
            center: ['50%', '25%'],
            dataLabels: {
              useHTML: true,
              enabled: true,
              format: '<div class="dataLabels"><b>{point.name}</b>: {point.y}</div>',
              style: {
                color: 'rgba(26, 178, 255, 1)'
              }
            },
          }
        },
        series: [{
          type: 'pie',
          name: '性别统计',
          data: this.listData
        }]
      });
    }
  }
}
</script>

<style lang="scss" scoped>
.echarts1 {
  position: relative;
  width: 100%;
  height: calc(100% - 0px);
  background: url("../assets/dizuo.png") center bottom no-repeat;
  background-size: 314px 191px;
}
</style>
<style lang="scss">
.dataLabels {
  font-size: 14px;
  color: #fff;
}
</style>