vue3 数据可视化大屏 项目开发时,需要渲染3d饼状图,这里使用的highcharts实现的效果。
版本号选择
不知道为啥使用最新的版本11 显示效果异常,所以改为了10.1.0
"highcharts": "10.1.0",
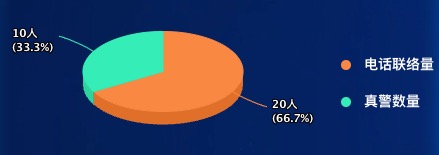
演示实例
使用组件
<template>
  <div class="itemBodys">
    <echarts :list="listData"></echarts>
  </div>
</template>

<script>
import echarts from "./components/echarts.vue";

export default {
  data() {
    return {
      listData: [
        {
          name: '电话联络量',
          value: 20,
          id: 'teacherGradeJuniorCollegeAndBelowNumber',
          itemStyle: {
            color: 'rgba(249, 137, 66, 0.8)',
          }
        }, {
          name: '真警数量',
          value: 10,
          id: 'teacherGradeUndergraduateNumber',
          itemStyle: {
            color: 'rgba(38, 237, 183, 0.8)'
          }
        }],
    }
  },
  components: {echarts},
  computed: {},
  mounted() {
    var that = this;
  },
  methods: {},
  filters: {},
  watch: {}
}
</script>

<style lang="scss" scoped>
.itemBodys {
  width: 100%;
  position: relative;
  height: calc(100% - 0px);
}

.echartsBody {
  position: relative;
  width: 100%;
  height: calc(100% - 0px);
  display: flex;
  justify-content: flex-start;
  align-items: center;
  flex-wrap: nowrap;
  flex-direction: row;
  align-content: flex-start;
}
</style>
组件代码
<template>
  <div class="echarts1" :id="className" ref="echarts1">

  </div>
</template>

<script>

import highcharts from "highcharts";
import highcharts3d from 'highcharts/highcharts-3d'

highcharts3d(highcharts)
export default {
  name: 'echarts1',
  components: {},
  data() {
    return {
      className: ''
    }
  },

  props: {
    colorList: {
      type: Array,
      default() {
        return [];
      }
    },
    list: {
      type: Array,
      default() {
        return [];
      }
    },
  },
  computed: {
    listData: function () {
      var that = this;
      var data = []
      that.list.forEach((type) => {
        var data2 = []
        data2.push(type.name)
        data2.push(Number(type.value))
        data.push(data2)
      });
      console.log(data)
      return data
    }
  },
  mounted() {
    this.className = 'container' + this.randomString(10)
    this.$nextTick(() => {
      this.drawLine()
    })
  },
  methods: {
    randomString(e) {
      e = e || 32;
      var t = "ABCDEFGHJKMNPQRSTWXYZabcdefhijkmnprstwxyz2345678",
          a = t.length,
          n = "";
      for (var i = 0; i < e; i++) n += t.charAt(Math.floor(Math.random() * a));
      return n
    },
    drawLine() {
      var that = this;
      var chart = highcharts.chart(this.className, {
        title: {
          text: ''
        },
        chart: {
          type: 'pie',
          backgroundColor: 'rgba(0,0,0,0)',
          options3d: {
            enabled: true,
            alpha: 60,
            beta: 0
          }
        },
        colors: ['rgba(249, 137, 66, 1)', 'rgba(38, 237, 183, 1)', 'rgba(48, 114, 228, 1)', 'rgba(133, 199, 251, 1)'],
        legend: { // 【图例】位置样式
          backgroundColor: 'rgba(0,0,0,0)',
          shadow: false,
          layout: 'vertical',
          align: 'right', // 水平方向位置
          verticalAlign: 'middle', // 垂直方向位置
          symbolPadding: 10,
          symbolHeight: 10,
          padding: 0,
          itemMarginTop: 20,
          itemStyle: {
            lineHeight: '24px',
            fontSize: '14px',
            color: '#fff'
          }
        },
        credits: {
          enabled: false
        },
        tooltip: {
          pointFormat: '{series.name}: <b>{point.percentage:.1f}%</b>'
        },
        plotOptions: {
          pie: {
            allowPointSelect: false,
            cursor: 'pointer',
            depth: 20,
            width: 1,
            size: 160,
            innerSize: 0,
            showInLegend: true,
            lineWidth: 1,
            borderWidth: 1,
            dataLabels: {
              padding: 0,
              format: '{y}人<br>({point.percentage:.1f}%)',
              show: true,
              enabled: true,
              style: {
                color: '#fff'
              }
            },
          }
        },
        series: [{
          type: 'pie',
          name: '报警占比',
          data: that.listData
        }]
      });
    }
  }
}
</script>

<style lang="scss" scoped>
.echarts1 {
  position: relative;
  width: 100%;
  height: calc(100% - 0px);
}

</style>