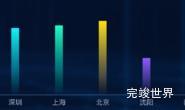
数据可视化大屏项目开发中,在渲染柱状图的时候,需要鼠标放在柱状图后,tooltip显示的内容要自定义显示样式和内容。
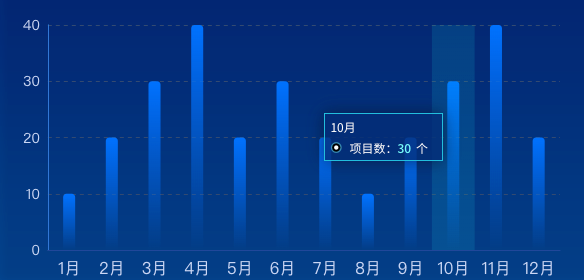
演示实例
实现
echarts tooltip 默认自带一个半透明的背景色,为了不被这个半透明影响我们的样式效果,我们需要将这个半透明设置为透明backgroundColor: 'rgba(50,50,50,0)',然后通过formatter来设置自定义html内容,通过css实现我们想要的效果,5.0的版本还会出现边线,这里我们将变现设置为0
tooltip: {
  trigger: 'axis',
  backgroundColor: 'rgba(50,50,50,0)',
  borderWidth: 0,
  axisPointer: {
    type: 'shadow',
    shadowStyle: {
      color: new echarts.graphic.LinearGradient(0, 0, 0, 1, [{
        offset: 0,
        color: 'rgba(0, 234, 255, 0.1)'
      }, {
        offset: 1,
        color: 'rgba(0, 234, 255, 0.1)'
      }], false),
    }
  },
  formatter: function (params) {
    var tipHtml = '';
    tipHtml = `<div class="infoPop">
<div class="infoTitle">${params[0].name}</div>
<div class="infoDesc"><div class="popIcon"></div><p>项目数:<span>${params[0].value}</span>个</p></div>
</div>`;
    return tipHtml;
  }
},
css
<style lang="scss">
.infoPop {
  width: 107px;
  background: rgba(2, 45, 119, 0.8);
  border: 1px solid #01BEDD;
  box-shadow: 0px 0px 16px 0px rgba(4, 21, 52, 0.7);
  padding: 2px 5px;

  .infoTitle {
    font-size: 12px;
    font-family: Source Han Sans CN;
    font-weight: 400;
    color: #FFFFFF;
  }

  .infoDesc {
    display: flex;
    justify-content: flex-start;
    align-items: center;
    flex-wrap: nowrap;
    flex-direction: row;
    align-content: flex-start;

    .popIcon {
      background: url("../../assets/popIcon.png") no-repeat;
      width: 12px;
      height: 11px;
      background-size: 100% 100%;
      margin-right: 7px;
    }

    p {
      margin: 0;
      font-size: 10px;
      font-family: Source Han Sans CN;
      font-weight: 400;
      color: #FFFFFF;

      span {
        font-size: 10px;
        font-family: Source Han Sans CN;
        font-weight: 500;
        color: #75FBFC;
        margin-right: 5px;
      }
    }
  }
}
</style>
完整效果
<template>
  <div class="echarts1" ref="echarts">
  </div>
</template>
<script>
import * as echarts from "echarts"

export default {
  name: 'echarts1',
  components: {},
  props: {
    id: {
      type: String,
      default() {
        return ''
      }
    }
  },
  data() {
    return {
      status: '',
      active: false,
      xData: ['1月', '2月', '3月', '4月', '5月', '6月', '7月', '8月', '9月', '10月', '11月', '12月'],
      yData1: [10, 20, 30, 40, 20, 30, 20, 10, 20, 30, 40, 20, 30, 20, 10, 20, 30, 40, 20, 30, 20,],
    }
  },
  watch: {},
  mounted() {
    this.drawLine()
  },
  methods: {
    drawLine() {
      // 基于准备好的dom,初始化echarts实例
      window.addEventListener('resize', this.drawLine)
      let myChart = echarts.init(this.$refs.echarts)
      var option = {
        grid: {
          top: '30px',
          bottom: '0px',
          left: '0px',
          right: '10px',
          containLabel: true
        },
        tooltip: {
          trigger: 'axis',
          backgroundColor: 'rgba(50,50,50,0)',
          axisPointer: {
            type: 'shadow',
            shadowStyle: {
              color: new echarts.graphic.LinearGradient(0, 0, 0, 1, [{
                offset: 0,
                color: 'rgba(0, 234, 255, 0.1)'
              }, {
                offset: 1,
                color: 'rgba(0, 234, 255, 0.1)'
              }], false),
            }
          },
          formatter: function (params) {
            var tipHtml = '';
            console.log(params[0])
            tipHtml = `<div class="infoPop">
<div class="infoTitle">${params[0].name}</div>
<div class="infoDesc"><div class="popIcon"></div><p>项目数:<span>${params[0].value}</span>个</p></div>
</div>`;
            return tipHtml;
          }
        },
        legend: {
          top: 0,
          show: false,
          right: 'center',
          itemWidth: 10,
          itemHeight: 10,
          textStyle: {
            color: 'rgba(157, 185, 233, 1)',
            fontSize: '14'
          },
        },
        xAxis: [
          {
            data: this.xData,
            axisLabel: {
              margin: 10,
              color: 'rgba(202, 215, 245, 1)',
              textStyle: {
                fontSize: 16
              },
            },
            axisLine: {
              lineStyle: {
                color: '#20479a',
                width: 1
              }
            },
            splitLine: {
              show: false,
              lineStyle: {
                color: 'rgba(39, 76, 129, 0.26)',
                width: 1,
              }
            },
            axisTick: {
              show: false
            },
          }],

        yAxis: [
          {
            type: 'value',
            axisLabel: {
              color: 'rgba(202, 215, 245, 1)',
              textStyle: {
                fontSize: 14
              },
            },
            axisLine: {
              lineStyle: {
                color: 'rgba(49, 119, 214, 1)',
              }
            },
            axisTick: {
              show: false
            },
            splitLine: {
              show: true,
              lineStyle: {
                color: '#334a71',
                width: 1,
                type: 'dashed'
              }
            }
          }],
        series: [
          {
            name: '近12个月抽检项目数',
            type: 'bar',
            data: this.yData1,
            barWidth: '12',
            itemStyle: {
              normal: {
                color: new echarts.graphic.LinearGradient(0, 0, 0, 1, [{
                  offset: 0,
                  color: 'rgba(0, 114, 255, 1)'
                }, {
                  offset: 1,
                  color: 'rgba(0, 114, 255, 0)'
                }], false),
                barBorderRadius: [4, 4, 0, 0],
              }
            },
          }]
      }
      myChart.clear()
      myChart.resize()
      myChart.setOption(option)
    },
  }
}
</script>

<style lang="scss" scoped>
.echarts1 {
  position: relative;
  width: 100%;
  height: 100%;
}
</style>
<style lang="scss">
.infoPop {
  width: 107px;
  background: rgba(2, 45, 119, 0.8);
  border: 1px solid #01BEDD;
  box-shadow: 0px 0px 16px 0px rgba(4, 21, 52, 0.7);
  padding: 2px 5px;

  .infoTitle {
    font-size: 12px;
    font-family: Source Han Sans CN;
    font-weight: 400;
    color: #FFFFFF;
  }

  .infoDesc {
    display: flex;
    justify-content: flex-start;
    align-items: center;
    flex-wrap: nowrap;
    flex-direction: row;
    align-content: flex-start;

    .popIcon {
      background: url("../../assets/popIcon.png") no-repeat;
      width: 12px;
      height: 11px;
      background-size: 100% 100%;
      margin-right: 7px;
    }

    p {
      margin: 0;
      font-size: 10px;
      font-family: Source Han Sans CN;
      font-weight: 400;
      color: #FFFFFF;

      span {
        font-size: 10px;
        font-family: Source Han Sans CN;
        font-weight: 500;
        color: #75FBFC;
        margin-right: 5px;
      }
    }
  }
}
</style>