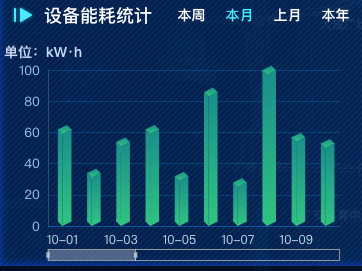
数据大屏项目开发中,柱状图需要显示四种日期的数据,本周只有7天 本月有30多条 上月也有30多条,这种数据量很大渲染的话肯定放不开,这就需要dataZoom来进行拖动显示,但是数据少的又不需要,所以我们需要进行判断显示
判断显示
我们需要根据数据长度进行判断,当数据长度大于12点话就显示dataZoom,并且end也做对应处理。这样就可以根据数据的长度进行动态显示了。
dataZoom: [
{
show: this.list.length > 12 ? true : false,
height: 12,
xAxisIndex: [
  0
],
bottom: '5',
start: 0,   // 使用dataZoomStart设置start属性
end: this.list.length > 12 ? 30 : 100,        // 使用dataZoomEnd设置end属性
handleStyle: {
  color: "#d3dee5",

},
textStyle: {
  color: "#fff"
},
borderColor: "#90979c"
}],
完整实例
<template>
  <div class="echarts1" ref="echarts">
  </div>
</template>
<script>
import * as echarts from "echarts"

export default {
  name: 'echarts1',
  components: {},
  data() {
    return {}
  },
  props: {
    list: {
      type: Array,
      default() {
        return [];
      }
    }
  },
  watch: {
    list() {
      this.drawEcharts()
    }
  },
  mounted() {
    var that = this;
    const viewElem = document.body;
    // 监听窗口变化,重绘echarts
    const resizeObserver = new ResizeObserver(() => {
      setTimeout(() => {
        that.drawEcharts();
      }, 300)
    });
    resizeObserver.observe(viewElem);
  },
  methods: {
    drawEcharts() {
      // 基于准备好的dom,初始化echarts实例
      let myChart = echarts.init(this.$refs.echarts)
      const CubeLeft = echarts.graphic.extendShape({
        shape: {
          x: 0,
          y: 0
        },
        buildPath: function (ctx, shape) {
          const xAxisPoint = shape.xAxisPoint
          const c0 = [shape.x, shape.y]
          const c1 = [shape.x - 4.5, shape.y - 4.5]
          const c2 = [xAxisPoint[0] - 4.5, xAxisPoint[1] - 4.5]
          const c3 = [xAxisPoint[0], xAxisPoint[1]]
          ctx.moveTo(c0[0], c0[1]).lineTo(c1[0], c1[1]).lineTo(c2[0], c2[1]).lineTo(c3[0], c3[1]).closePath()
        }
      })
      const CubeRight = echarts.graphic.extendShape({
        shape: {
          x: 0,
          y: 0
        },
        buildPath: function (ctx, shape) {
          const xAxisPoint = shape.xAxisPoint
          const c1 = [shape.x, shape.y]
          const c2 = [xAxisPoint[0], xAxisPoint[1]]
          const c3 = [xAxisPoint[0] + 9, xAxisPoint[1] - 4.5]
          const c4 = [shape.x + 9, shape.y - 4.5]
          ctx.moveTo(c1[0], c1[1]).lineTo(c2[0], c2[1]).lineTo(c3[0], c3[1]).lineTo(c4[0], c4[1]).closePath()
        }
      })
      const CubeTop = echarts.graphic.extendShape({
        shape: {
          x: 0,
          y: 0
        },
        buildPath: function (ctx, shape) {
          const c1 = [shape.x, shape.y]
          const c2 = [shape.x + 9, shape.y - 4.5]
          const c3 = [shape.x + 4.5, shape.y - 9]
          const c4 = [shape.x - 4.5, shape.y - 4.5]
          ctx.moveTo(c1[0], c1[1]).lineTo(c2[0], c2[1]).lineTo(c3[0], c3[1]).lineTo(c4[0], c4[1]).closePath()
        }
      })
      echarts.graphic.registerShape('CubeLeft', CubeLeft)
      echarts.graphic.registerShape('CubeRight', CubeRight)
      echarts.graphic.registerShape('CubeTop', CubeTop)
      const VALUE = this.list.map(obj => obj.value)
      var option = {
        grid: {
          top: '30px',
          bottom: '20px',
          left: '20px',
          right: '30px',
          containLabel: true
        },
        tooltip: {
          trigger: 'axis',
          axisPointer: {
            type: 'shadow'
          }
        },
        title: {
          text: '单位:kW·h',
          left: 'left',
          top: 0,
          textStyle: {
            color: 'rgba(202, 215, 245, 1)',
            fontSize: 14
          }
        },
        dataZoom: [
          {
            show: this.list.length > 12 ? true : false,
            height: 12,
            xAxisIndex: [
              0
            ],
            bottom: '5',
            start: 0,   // 使用dataZoomStart设置start属性
            end: this.list.length > 12 ? 30 : 100,        // 使用dataZoomEnd设置end属性
            handleStyle: {
              color: "#d3dee5",

            },
            textStyle: {
              color: "#fff"
            },
            borderColor: "#90979c"
          }],
        xAxis: {
          type: 'category',
          data: this.list.map(obj => obj.name),
          axisLine: {
            show: true,
            lineStyle: {
              color: 'rgba(0, 164, 255, 0.2)',
              fontSize: '12px'
            }
          },
          offset: 0,
          axisTick: {
            show: false,
            length: 9,
            alignWithLabel: true,
            lineStyle: {
              color: '#7DFFFD'
            }
          },
          axisLabel: {
            fontSize: 12,
            color: 'rgba(194, 214, 235, 1)',

          },
          splitLine: {
            show: false,
            lineStyle: {color: 'red'}
          }
        },
        yAxis: [
          {
            type: 'value',
            axisLine: {
              lineStyle: {
                color: 'rgba(46, 76, 110, 1)',
              }
            },
            splitLine: {
              show: true,
              lineStyle: {
                color: 'rgba(0, 164, 255, 0.2)',
                fontSize: '12px'
              }
            },
            axisTick: {
              show: false
            },
            axisLabel: {
              fontSize: 13,
              color: 'rgba(152, 191, 251, 1)'
            },
          }
        ],
        series: [
          {
            type: 'custom',
            name: '设备能耗统计',
            renderItem: (params, api) => {
              const location = api.coord([api.value(0), api.value(1)])
              return {
                type: 'group',
                children: [{
                  type: 'CubeLeft',
                  shape: {
                    api,
                    xValue: api.value(0),
                    yValue: api.value(1),
                    x: location[0],
                    y: location[1],
                    xAxisPoint: api.coord([api.value(0), 0])
                  },
                  style: {
                    fill: new echarts.graphic.LinearGradient(0, 0, 0, 1, [{
                      offset: 0,
                      color: 'rgba(26, 142, 139, 1)'
                    },
                      {
                        offset: 1,
                        color: 'rgba(49, 196, 130, 1)'
                      }
                    ])
                  }
                }, {
                  type: 'CubeRight',
                  shape: {
                    api,
                    xValue: api.value(0),
                    yValue: api.value(1),
                    x: location[0],
                    y: location[1],
                    xAxisPoint: api.coord([api.value(0), 0])
                  },
                  style: {
                    fill: new echarts.graphic.LinearGradient(0, 0, 0, 1, [{
                      offset: 0,
                      color: 'rgba(26, 142, 139, 1)'
                    },
                      {
                        offset: 1,
                        color: 'rgba(49, 196, 130, 1)'
                      }
                    ])
                  }
                }, {
                  type: 'CubeTop',
                  shape: {
                    api,
                    xValue: api.value(0),
                    yValue: api.value(1),
                    x: location[0],
                    y: location[1],
                    xAxisPoint: api.coord([api.value(0), 0])
                  },
                  style: {
                    fill: new echarts.graphic.LinearGradient(0, 0, 0, 1, [{
                      offset: 0,
                      color: 'rgba(26, 142, 139, 1)'
                    },
                      {
                        offset: 1,
                        color: 'rgba(49, 196, 130, 1)'
                      }
                    ])
                  }
                }]
              }
            },
            data: VALUE
          },
        ]
      }
      myChart.clear()
      myChart.resize()
      myChart.setOption(option)
    },
  }
}
</script>

<style lang="scss" scoped>
.echarts1 {
  position: relative;
  width: 100%;
  height: 100%;
}
</style>


