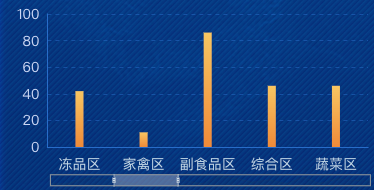
echarts柱状图数据过多时,客户会想让柱状图下的dataZoom自动切换轮播展示。
效果代码
实现思路 我们设置start和end两个值,定时每次增加20然后更新dataZoom当dataZoom达到100后,再从新开始,以此实现dataZoom的数据轮播显示。
<script>
import * as echarts from "echarts"

export default {
  name: 'echarts1',
  components: {},
  props: {
    list: {
      type: Array,
      default() {
        return []
      }
    }
  },
  data() {
    return {
      dataZoomStart: 0,  // 新增属性,表示dataZoom的起始位置
      dataZoomEnd: 20    // 表示dataZoom的结束位置
    }
  },
  watch: {
    list() {
      this.drawEcharts()
    }
  },
  mounted() {
    var that = this;
    setInterval(this.updateDataZoom, 5000);
  },
  methods: {
    updateDataZoom() {
      // 每次增加20,以便每次显示新的5个数据点
      this.dataZoomStart += 20;
      this.dataZoomEnd += 20;

      // 如果dataZoomEnd大于100,则重置为20,并相应地重置dataZoomStart为0
      if (this.dataZoomEnd > 100) {
        this.dataZoomStart = 0;
        this.dataZoomEnd = 20;
      }

      // 重新绘制图表
      this.drawEcharts();
    },
    drawEcharts() {
        if (!this.$refs.echarts) return;
      let myChart = echarts.init(this.$refs.echarts)
      var option = {
        grid: {
          top: '10px',
          bottom: '20px',
          left: '20px',
          right: '20px',
          containLabel: true
        },
        tooltip: {
          trigger: 'axis'
        },
        dataZoom: [
          {
            show: true,
            height: 12,
            xAxisIndex: [
              0
            ],
            bottom: '5',
            start: this.dataZoomStart,   // 使用dataZoomStart设置start属性
            end: this.dataZoomEnd,        // 使用dataZoomEnd设置end属性
            handleStyle: {
              color: "#d3dee5",

            },
            textStyle: {
              color: "#fff"
            },
            borderColor: "#90979c"
          }],
        xAxis: [{
          data: this.list.map(obj => obj.name),
          axisLabel: {
            margin: 10,
            interval: 0,
            rotate: 0,
            color: 'rgba(193, 215, 230, 1)',
            textStyle: {
              fontSize: 14
            },
          },
          axisLine: {
            lineStyle: {
              color: 'rgba(40, 108, 201, 1)',
              width: 1
            }
          },
          splitLine: {
            show: false,
            lineStyle: {
              color: 'rgba(39, 76, 129, 0.26)',
              width: 1,
            }
          },
          axisTick: {
            show: false
          },
        }],

        yAxis: [
          {
            type: 'value',
            axisLabel: {
              color: 'rgba(202, 215, 245, 1)',
              textStyle: {
                fontSize: 14
              },
            },
            axisLine: {
              lineStyle: {
                color: 'rgba(40, 108, 201, 1)',
              }
            },
            axisTick: {
              show: false
            },
            splitLine: {
              show: true,
              lineStyle: {
                color: 'rgba(40, 108, 201, 0.5)',
                width: 1,
                type: 'dashed'
              }
            }
          },
        ],
        series: [
          {
            name: '30天追溯数据监控',
            type: 'bar',
            data: this.list.map(obj => obj.value),
            barWidth: '8px',
            itemStyle: {
              normal: {
                color: new echarts.graphic.LinearGradient(0, 0, 0, 1, [{
                  offset: 0,
                  color: 'rgba(0, 217, 255, 1)'
                }, {
                  offset: 1,
                  color: 'rgba(11, 51, 142, 1)'
                }], false),
              }
            },
          }]
      }
      myChart.clear()
      myChart.resize()
      myChart.setOption(option)
    },
  }
}
</script>
报错问题
因为有定时,当我们跳转到其他页面的时候,会报下面的错误
TypeError: Cannot read properties of null (reading 'getAttribute')
    at Object.getAttribute (model.js:494:14)
    at getInstanceByDom (echarts.js:1999:30)
    at Object.init (echarts.js:1922:23)
    at Proxy.drawEcharts (index.vue:54:29)
    at Proxy.updateDataZoom (index.vue:51:12)
这是因为对应的DOM已经不存在了,但是定时仍然在触发,我们在之前的代码基础上增加一个判断 if (!this.$refs.echarts) return; 如果dom不存在了则不向下执行。
drawEcharts() {
  if (!this.$refs.echarts) return;

  let myChart = echarts.init(this.$refs.echarts);
  // ... rest of the method
}


