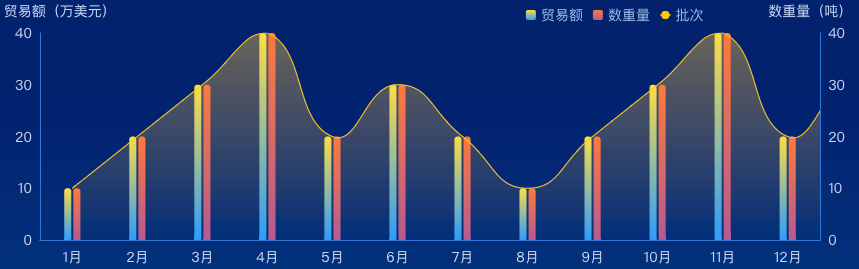
echarts 实现左右两个y轴柱状图,添加单位,双渐变色柱状图,折线图底部颜色渐变。
组件代码
<template>
  <div class="echarts1" ref="echarts">
  </div>
</template>
<script>
import * as echarts from "echarts"

export default {
  name: 'echarts1',
  components: {},
  props: {
    id: {
      type: String,
      default() {
        return ''
      }
    }
  },
  data() {
    return {
      status: '',
      active: false,
      xData: ['1月', '2月', '3月', '4月', '5月', '6月', '7月', '8月', '9月', '10月', '11月', '12月'],
      yData1: [10, 20, 30, 40, 20, 30, 20, 10, 20, 30, 40, 20, 30, 20,],
      yData2: [10, 20, 30, 40, 20, 30, 20, 10, 20, 30, 40, 20, 30, 20,],
      yData3: [10, 20, 30, 40, 20, 30, 20, 10, 20, 30, 40, 20, 30, 20,],
    }
  },
  watch: {},
  mounted() {
    this.drawLine()
  },
  methods: {
    drawLine() {
      // 基于准备好的dom,初始化echarts实例
      window.addEventListener('resize', this.drawLine)
      let myChart = echarts.init(this.$refs.echarts)
      var option = {
        grid: {
          top: '30px',
          bottom: '0px',
          left: '20px',
          right: '20px',
          containLabel: true
        },
        tooltip: {
          trigger: 'axis',
          axisPointer: {
            type: 'shadow',
            shadowStyle: {
              color: new echarts.graphic.LinearGradient(0, 0, 0, 1, [{
                offset: 0,
                color: 'rgba(255, 174, 0, 0.1)'
              }, {
                offset: 1,
                color: 'rgba(255, 174, 0, 0.5)'
              }], false),
            }
          }
        },
        legend: {
          top: 0,
          right: '18%',
          itemWidth: 10,
          itemHeight: 10,
          textStyle: {
            color: 'rgba(157, 185, 233, 1)',
            fontSize: '14'
          },
        },
        xAxis: [{
          data: this.xData,
          axisLabel: {
            margin: 10,
            color: 'rgba(202, 215, 245, 1)',
            textStyle: {
              fontSize: 14
            },
          },
          axisLine: {
            lineStyle: {
              color: 'rgba(49, 119, 214, 1)',
              width: 1
            }
          },
          splitLine: {
            show: false,
            lineStyle: {
              color: 'rgba(39, 76, 129, 0.26)',
              width: 1,
            }
          },
          axisTick: {
            show: false
          },
        }],

        yAxis: [
          {
            type: 'value',
            name: '贸易额(万美元)',
            nameTextStyle: {
              color: 'rgba(202, 215, 245, 1)',
              fontSize: 14,
              padding: [0, 0, 0, 40]
            },
            axisLabel: {
              color: 'rgba(202, 215, 245, 1)',
              textStyle: {
                fontSize: 14
              },
            },
            axisLine: {
              lineStyle: {
                color: 'rgba(49, 119, 214, 1)',
              }
            },
            axisTick: {
              show: false
            },
            splitLine: {
              show: false,
              lineStyle: {
                color: 'rgba(39, 76, 129, 0.26)',
                width: 1,
              }
            }
          }, {
            type: 'value',
            name: '数重量(吨)',
            nameTextStyle: {
              color: 'rgba(202, 215, 245, 1)',
              fontSize: 14,
              padding: [0, 0, 0, -20]
            },
            axisLabel: {
              color: 'rgba(202, 215, 245, 1)',
              textStyle: {
                fontSize: 14
              },
            },
            axisLine: {
              lineStyle: {
                color: 'rgba(49, 119, 214, 1)',
              }
            },
            axisTick: {
              show: false
            },
            splitLine: {
              show: false,
              lineStyle: {
                color: 'rgba(39, 76, 129, 0.26)',
                width: 1,
              }
            }
          },],
        series: [
          {
            name: '贸易额',
            type: 'bar',
            data: this.yData1,
            barWidth: '7px',
            itemStyle: {
              normal: {
                color: new echarts.graphic.LinearGradient(0, 0, 0, 1, [{
                  offset: 0,
                  color: 'rgba(254, 221, 66, 1)'
                }, {
                  offset: 1,
                  color: 'rgba(47, 156, 252, 1)'
                }], false),
                barBorderRadius: [4, 4, 0, 0],
              }
            },
          },
          {
            name: '数重量',
            type: 'bar',
            data: this.yData2,
            barWidth: '7px',
            itemStyle: {
              normal: {
                color: new echarts.graphic.LinearGradient(0, 0, 0, 1, [{
                  offset: 0,
                  color: 'rgba(253, 122, 60, 1)'
                }, {
                  offset: 1,
                  color: 'rgba(182, 90, 145, 1)'
                }], false),
                barBorderRadius: [4, 4, 0, 0],
              }
            },
          },
          {
            name: '批次',
            type: 'line',
            yAxisIndex: 1,
            data: this.yData3,
            smooth: true,
            symbol: 'circle', //数值点设定为实心点
            symbolSize: 0, // 折线的点的大小
            itemStyle: {
              normal: {
                color: 'rgba(253, 203, 0, 1)', //点的颜色
                lineStyle: {
                  color: 'rgba(253, 203, 0, 1)', //线的颜色
                  width: 1, // 折线图线条粗细设置
                },
              },
            },
            areaStyle: {
              normal: {
                color: new echarts.graphic.LinearGradient(0, 0, 0, 1, [{
                  offset: 0,
                  color: 'rgba(253, 203, 0, 0.5)'
                },
                  {
                    offset: 1,
                    color: 'rgba(253, 203, 0, 0)'
                  }
                ], false),
              }
            },
          }]
      }
      myChart.clear()
      myChart.resize()
      myChart.setOption(option)
    },
  }
}
</script>

<style lang="scss" scoped>
.echarts1 {
  position: relative;
  width: 100%;
  height: 100%;
}
</style>


