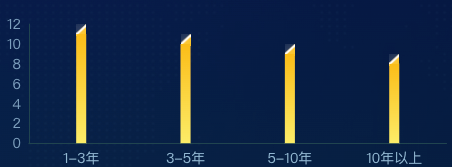
数据大屏项目中柱状图为了美观会设计不同样式的柱状图,今天的柱状图效果是渐变色,柱状图顶部是一个倾斜角,因为echarts实现不了这个倾斜角,所以我们使用图片来实现。
实例代码
<template>
  <div class="item2" ref="myChart1">

  </div>
</template>

<script>

import * as echarts from 'echarts'
import icon1 from './assets/qingxie.png'

export default {
  name: "echarts1",
  data() {
    return {
      yData: [11, 10, 9, 8],
      data: [
        '1-3年',
        '3-5年',
        '5-10年',
        '10年以上'],
      yData2: [{
        value: 11,
        symbol: 'image://' + icon1,
      }, {
        value: 10,
        symbol: 'image://' + icon1,
      }, {
        value: 9,
        symbol: 'image://' + icon1,
      }, {
        value: 8,
        symbol: 'image://' + icon1,
      }],
    }
  },
  watch: {},
  mounted() {
    this.drawLine()
  },
  methods: {
    drawLine() {
      var that = this
      window.addEventListener('resize', this.drawLine)
      let myChart = echarts.init(this.$refs.myChart1)
      var option = {
        grid: {
          left: '0%',
          right: '3%',
          top: '15%',
          bottom: '10%',
          containLabel: true
        },
        tooltip: {
          show: true,
          trigger: 'axis',
        },
        xAxis: {
          data: this.data,
          axisLine: {
            lineStyle: {
              color: '#204450'
            }
          },
          axisTick: {
            show: false
          },
          axisLabel: {
            color: 'rgba(148, 185, 212, 1)',
            fontSize: 14,
          }
        },
        yAxis: [
          {
            show: true,
            nameTextStyle: {
              color: 'rgba(150, 175, 220, 1)',
              fontSize: 13
            },
            axisLine: {
              show: true,
              lineStyle: {
                color: '#204450'
              }
            },
            axisTick: {
              show: false
            },
            axisLabel: {
              color: '#7d9fbe',
              fontSize: 14
            },
            splitLine: {
              show: false,
              lineStyle: {
                color: '#2d3d53',
                type: 'dashed'
              }
            },
            yAxisIndex: 0
          }],
        series: [
          {
            name: '党龄统计',
            type: 'bar',
            barWidth: 10,
            z: 2,
            itemStyle: {
              normal: {
                color: function (params) {
                  return new echarts.graphic.LinearGradient(0, 0, 0, 1, [{
                    offset: 0,
                    color: 'rgba(251, 189, 24, 1)'
                  }, {
                    offset: 1,
                    color: 'rgba(252, 236, 104, 1)'
                  }], false)
                }
              }
            },
            label: {
              show: false,
              position: "top",
              formatter: function (value, index) {
                return 'TOP' + (Number(value.dataIndex) + 1)
              },
              offset: [0, -20],
              color: function (params) {
                return that.color1[params.dataIndex];
              },
              fontSize: 16,
              fontFamily: 'DIN',
              fontWeight: 'bold',
            },
            data: this.yData
          },
          {
            "data": this.yData2,
            "type": "pictorialBar",
            "barMaxWidth": "9",
            "symbolPosition": "end",
            "symbol": "Rectangle",
            "symbolOffset": [0, -10],
            "symbolSize": [10, 12],
            "z": 2,
            tooltip: {
              show: false
            },
            itemStyle: {
              normal: {
                borderWidth: 0,
                color: 'rgba(254, 254, 254, 1.00)',
              }
            },
          },
        ]
      }
      myChart.clear()
      myChart.resize()
      myChart.setOption(option)
    },
  },
}
</script>

<style lang="scss" scoped>
.item2 {
  position: relative;
  width: calc(100% - 35px - 0px);
  margin-left: 0px;
  height: calc(100% - 0px);
}
</style>


