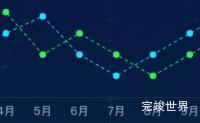
vue 可视化大屏 项目开发中,两种颜色的虚线折线图,将实现代码记录下来。
演示实例
组件代码
<template>
<div class="echarts1" ref="echarts">
</d...
2年前 (2023-05-14)
喜欢
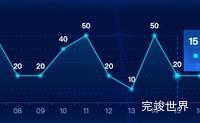
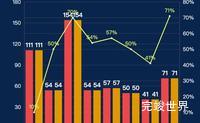
vue 可视化大屏 项目开发中,需要折线图中显示最大值的label,这里我们通过lodash来获取数组的最大值,然后判断,如果当前值和最大值一致就显示对应区域的label
演示实例
组件代码
<template>
<div class="ech...
2年前 (2023-05-11)
喜欢
效果图
运行实例
代码
<template>
<div class="echarts1" ref="echarts">
</div>
</template>
<scrip...
3年前 (2022-07-02)
喜欢
Echarts tooltip 按照数据排序显示 排序前
Echarts tooltip 按照数据排序显示 排序后
tooltip: {
trigger: 'axis',
formatter: function(params){
let newParams = [];...
3年前 (2022-03-01)
喜欢
运行实例
代码
<template>
<div class="echarts1" ref="echarts">
</div>
</template>
<script>...
3年前 (2022-01-03)
喜欢
实际运行
代码
<template>
<div class="echarts1" ref="echarts">
</div>
</template>
<script>...
4年前 (2021-12-31)
喜欢
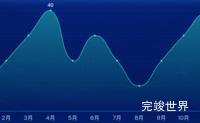
echarts 折线图 区域渐变色
代码
<template>
<div class="echarts1" ref="echarts">
</div>
</template>
&...
4年前 (2021-12-31)
喜欢
效果图
柱状图运行实例
代码
<template>
<div class="echarts1" ref="echarts">
</div>
</template>
<sc...
4年前 (2021-12-30)
喜欢