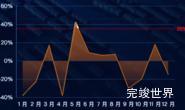
数据可视化大屏项目开发过程中,需要一些特效,今天整理的效果是echarts 折线图流光效果,流光效果不适用于平滑曲线。
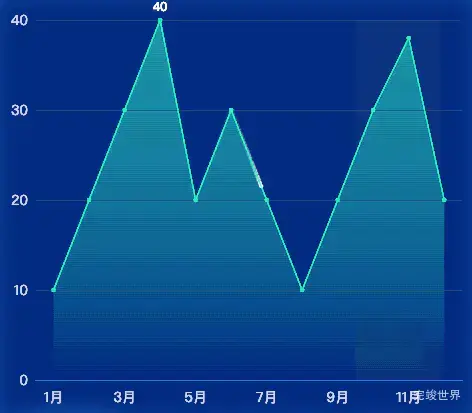
动态效果
实例代码
drawEcharts() {
  // 基于准备好的dom,初始化echarts实例
  let myChart = echarts.init(this.$refs.echarts)
  var max = lodash.max(this.yData1)
  let datacoords = [
    {
      coords: [],
    },
  ];
  for (let i = 0; i < this.xData.length; i++) {
    datacoords[0].coords.push([this.xData[i], this.yData1[i]]);
  }
  var yData = []
  this.yData1.forEach((type) => {
    yData.push({
      value: type,
      label: {
        normal: {
          show: max == type,
          position: 'top',
          color: '#fff',
          align: 'center',
          fontWeight: 500,
          fontSize: 12
        }
      },
    })
  });
  var option = {
    grid: {
      top: '30px',
      bottom: '20px',
      left: '20px',
      right: '20px',
      containLabel: true
    },
    tooltip: {
      trigger: 'axis',
      axisPointer: {
        type: 'shadow',
        shadowStyle: {
          color: new echarts.graphic.LinearGradient(0, 0, 0, 1, [{
            offset: 0,
            color: 'rgba(255, 174, 0, 0.1)'
          }, {
            offset: 1,
            color: 'rgba(255, 174, 0, 0.5)'
          }], false),
        }
      }
    },
    xAxis: [
      {
        data: this.xData,
        axisLabel: {
          margin: 10,
          color: 'rgba(202, 215, 245, 1)',
          textStyle: {
            fontSize: 14
          },
        },
        axisLine: {
          lineStyle: {
            color: 'rgba(49, 119, 214, 1)',
            width: 1
          }
        },
        splitLine: {
          show: false,
          lineStyle: {
            color: 'rgba(39, 76, 129, 0.26)',
            width: 1,
          }
        },
        axisTick: {
          show: false
        },
      }],
    yAxis: [
      {
        axisLabel: {
          color: 'rgba(202, 215, 245, 1)',
          textStyle: {
            fontSize: 14
          },
        },
        axisLine: {
          lineStyle: {
            color: 'rgba(49, 119, 214, 1)',
          }
        },
        axisTick: {
          show: false
        },
        splitLine: {
          show: true,
          lineStyle: {
            color: 'rgba(39, 76, 129, 0.26)',
            width: 1,
          }
        }
      }],
    series: [
      {
        name: '目标达成率',
        type: 'line',
        data: yData,
        symbol: 'circle', //数值点设定为实心点
        // symbolSize: 0, // 折线的点的大小
        itemStyle: {
          normal: {
            color: 'rgba(0, 240, 203, 0.8)', //点的颜色
            lineStyle: {
              color: 'rgba(0, 240, 203, 0.8)', //线的颜色
              width: 1, // 折线图线条粗细设置
            },
          },
        },
        areaStyle: {
          normal: {
            color: new echarts.graphic.LinearGradient(0, 0, 0, 1, [{
              offset: 0,
              color: 'rgba(0, 240, 203, 0.1)'
            },
              {
                offset: 1,
                color: 'rgba(0, 240, 203, 0)'
              }
            ], false),
          }
        },
      },
      // 以下代码为流光效果
      {
        polyline: true,
        showSymbol: false,
        name: "流动光线",
        type: "lines",
        coordinateSystem: "cartesian2d",
        effect: {
          trailLength: 0.3,
          show: true,
          period: 6,
          symbolSize: 4,
          loop: true,
        },
        lineStyle: {
          color: "#fff",
          width: 0,
          opacity: 0,
          curveness: 0,
          type: "dashed",
        },
        data: datacoords,
      },
    ]
  }
  myChart.clear()
  myChart.resize()
  myChart.setOption(option)
},
流光部分代码解释
这段代码定义了一个 ECharts 图表的 lines 系列,用于绘制一组连接的线段。让我们详细解释每个属性的作用:
-
polyline: true: 这个属性表示线段可以是多段线,即不仅仅是两个点之间的直线,还可以是多个点连接的折线。 -
showSymbol: false: 这个属性表示不显示标记点(即线段的起点和终点)。如果设置为true,则会在每个数据点上显示一个符号。 -
name: "流动光线": 这个属性设置了系列的名称,可以在图例、提示框等地方显示。 -
type: "lines": 这个属性设置了系列的类型为lines,表示这个系列用于绘制线段。 -
coordinateSystem: "cartesian2d": 这个属性设置了坐标系类型为笛卡尔二维坐标系。 -
effect: 这个对象定义了线段的动态效果。trailLength: 0.3: 指定拖尾的长度,取值范围是 0 到 1。show: true: 开启动态效果。period: 6: 动画的周期,单位为秒。symbolSize: 4: 动画中的符号大小。loop: true: 是否循环播放动画。
-
lineStyle: 这个对象定义了线段的样式。color: "#fff": 线段的颜色。width: 0: 线段的宽度。设置为 0 表示线段不可见。opacity: 0: 线段的透明度。设置为 0 表示线段完全透明。curveness: 0: 线段的曲率,取值范围是 0 到 1。设置为 0 表示线段是直的。type: "dashed": 线段的类型。设置为 "dashed" 表示线段是虚线。
-
data: datacoords: 这个属性设置了系列的数据。datacoords应该是一个包含线段坐标的数组。
总的来说,这段代码定义了一个 lines 系列,用于绘制一组透明的虚线段,并具有动态效果。这种效果通常用于表示流动或连接,例如流量图、网络图等。