echarts动态添加数据

echarts yekong 1739℃

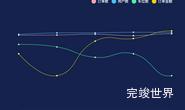
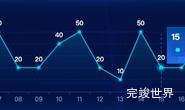
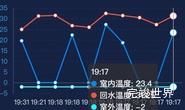
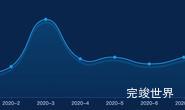
echarts动态添加数据,让echarts动起来。
wanjunshijiecom 2021-08-17 at 05.52.29

rtLine2: function () {
                var that = this;
                var data = this.qiaolist[this.select1].kualist[this.select2].yingli;
                datatime = [];
                for (var i = 0; i < data.length; i++) {
                    datatime.push(moment((moment().unix() - i) * 1000).format("HH:mm:ss"))
                }
                var datax = [];
                for (var i = 0; i < data.length; i++) {
                    var data3 = [];
                    for (var s = 0; s < 10; s++) {
                        data3.push(randomNum(0, 20))
                    }
                    var data2 = {
                        name: '挠度监测' + (i + 1),
                        type: 'line',
                        data: data3,
                        symbolSize: 1,
                        symbol: 'circle',
                        smooth: true,
                        yAxisIndex: 0,
                        showSymbol: false,
                        lineStyle: {
                            width: 2,
                        },
                    };
                    datax.push(data2)
                }
                var echartsx = echarts.init(document.getElementById("rtEchart2"));
                var option = {
                    tooltip: {
                        trigger: "axis",
                        axisPointer: {
                            type: "shadow",
                            textStyle: {
                                color: "#fff"
                            }
                        },
                    },
                    grid: {
                        left: '1%',
                        right: '2%',
                        bottom: '6px',
                        top: '5%',
                        containLabel: true
                    },
                    calculable: true,
                    xAxis: [{
                        type: "category",
                        axisLine: {
                            lineStyle: {
                                color: "#2a527f",
                            }
                        },
                        axisLabel: {
                            textStyle: {
                                color: '#b1ecff'
                            }
                        },
                        splitLine: {
                            show: false
                        },
                        axisTick: {
                            show: false
                        },
                        data: datatime,
                        boundaryGap: false
                    }],
                    yAxis: [
                        {
                            type: "value",
                            splitLine: {
                                show: false
                            },
                            axisLine: {
                                lineStyle: {
                                    color: "#2a527f",
                                }
                            },
                            axisLabel: {
                                textStyle: {
                                    color: '#b1ecff'
                                }
                            },

                        }],
                    series: datax
                };
                echartsx.setOption(
                    option
                );
                setInterval(function () {
                    option.xAxis[0].data.push(moment().format("HH:mm:ss"));
                    option.xAxis[0].data.splice(0, 1);
                    var datax = option.series;
                    for (var i = 0; i < datax.length; i++) {
                        datax[i].data.push(randomNum(0, 20))
                        datax[i].data.splice(0, 1)
                    }
                    echartsx.setOption(option)
                }, 1000)
            },
喜欢 (0)