echarts柱状图除了常见的柱状图外,还有一种是图片类型的柱状图,或者说图标柱状图,
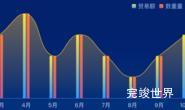
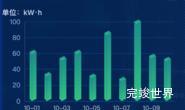
使用两张图标,一张图标表示底图,一张图标表示占比状态,通过pictorialBar来将两种图片图片重叠显示,达到类似下面的效果。

演示效果
实例代码
<template>
  <div class="echarts1" ref="echarts">

  </div>
</template>

<script>
import * as echarts from "echarts";
import book from '../assets/book.png'
import bookActive from '../assets/bookActive.png'

export default {
  name: 'echarts1',
  components: {},
  data() {
    return {
      data: 100
    }
  },
  props: {
    progress: {
      type: Number,
      default() {
        return 0
      }
    }
  },
  mounted() {
    this.drawEcharts()
  },
  methods: {
    drawEcharts() {
      var that = this
      window.addEventListener('resize', this.drawEcharts)
      let myChart = echarts.init(this.$refs.echarts)
      var img1 = {
        a: book,
        b: bookActive
      }
      var option = {
        grid: {
          left: "0%",
          top: "0%",
          bottom: "0%",
          right: "0%",
          containLabel: true
        },
        tooltip: {
          trigger: "item",
        },
        xAxis: {
          splitLine: {
            show: false
          },
          axisLine: {
            show: false
          },
          axisLabel: {
            show: false
          },
          axisTick: {
            show: false
          }
        },
        yAxis: [{
          type: "category",
          inverse: false,
          data: ["学院借阅情况(学生)"],
          axisLine: {
            show: false
          },
          axisTick: {
            show: false
          },
          splitLine: {
            show: false,
            lineStyle: {
              type: "dashed",
              color: "#3e86dd"
            }
          },
          axisLabel: {
            show: false,
            margin: 35,
            textStyle: {
              color: "#fff",
              fontSize: 14,
            }

          }
        }

        ],
        series: [
          {
            tooltip: {
              show: false
            },
            z: 4,
            type: "pictorialBar",
            symbolSize: ['30', '38'],
            symbolRepeat: "fixed",
            symbolOffset: [3, 0],
            data: [{
              value: that.data,
              symbol: 'image://' + img1.a,
            }
            ]
          },
          {
            z: 6,
            type: "pictorialBar",
            symbolSize: ['30', '38'],
            animation: true,
            symbolRepeat: "fixed",
            symbolClip: true,
            symbolPosition: "start",
            symbolOffset: [3, 0],
            data: [{
              value: that.progress,
              symbol: 'image://' + img1.b,
            }
            ],
            label: {
              normal: {
                show: false,
                textStyle: {
                  color: '#18fcff',
                  fontSize: 14,
                },
                position: "right",
                offset: [44, 0]
              }
            },
          },
          {
            type: "bar"
          },
        ]
      }
      myChart.clear()
      myChart.resize()
      myChart.setOption(option)
    },
  }
}
</script>

<style lang="scss" scoped>
.echarts1 {
  position: relative;
  width: 100%;
  height: calc(100% - 20px);
}
</style>