vue大屏项目 排行榜柱状图效果

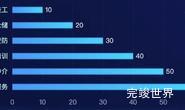
运行实例
代码
<template>
  <div ref="myChart1" class="myChart1">

  </div>
</template>

<script>

export default {
  name: "paihangbang",
  components: {},
  props: {
    id: {
      type: String,
      default() {
        return '';
      }
    }
  },
  data() {
    return {
      status: ''
    }
  },
  watch: {},
  mounted() {
    this.lines()
  },
  methods: {
    lines() {
      var that = this;
      window.addEventListener('resize', this.lines)
      let myChart = this.$echarts.init(this.$refs.myChart1);
      // import echarts from 'echarts'
      var charts = { // 按顺序排列从大到小
        cityList: ['西安省体广场', '上海家利物业', '江苏路劲物业', '广州绿地集团', '新疆天正通达'],
        cityData: [270, 260, 250, 240, 230],
        minData: [1, 1, 1, 1, 1]
      }
      var top10CityList = charts.cityList
      var top10CityData = charts.cityData
      var color = ['rgba(78, 197, 212', 'rgba(78, 197, 212', 'rgba(78, 197, 212', 'rgba(78, 197, 212', 'rgba(78, 197, 212']
      let lineY = []
      for (var i = 0; i < charts.cityList.length; i++) {
        var x = i
        if (x > color.length - 1) {
          x = color.length - 1
        }
        var data = {
          name: charts.cityList[i],
          color: color[x] + ')',
          value: top10CityData[i],
          itemStyle: {
            normal: {
              show: true,
              color: new that.$echarts.graphic.LinearGradient(0, 0, 1, 0, [{
                offset: 0,
                color: color[x] + ', 0.3)'
              }, {
                offset: 1,
                color: color[x] + ', 1)'
              }], false),
              barBorderRadius: 3
            },
            emphasis: {
              shadowBlur: 6,
              shadowColor: 'rgba(0, 0, 0, 0.1)'
            }
          }
        }
        lineY.push(data)
      }
      var option = {
        title: {
          show: false
        },
        tooltip: {
          trigger: 'item'
        },
        grid: {
          borderWidth: 0,
          top: '10%',
          left: '5%',
          right: '0%',
          bottom: '3%'
        },
        color: color,
        yAxis: [{
          type: 'category',
          inverse: true,
          axisTick: {
            show: false
          },
          axisLine: {
            show: false
          },
          axisLabel: {
            show: false,
            inside: false
          },
          data: top10CityList
        },
          {
            type: 'category',
            axisLine: {
              show: false
            },
            axisTick: {
              show: false
            },
            axisLabel: {
              show: false,
              inside: false,
              textStyle: {
                color: '#b3ccf8',
                fontSize: '12',
                fontFamily: 'PingFangSC-Regular'
              },
              formatter: function (val) {
                return `${val}k`
              }
            },
            splitArea: {
              show: false
            },
            splitLine: {
              show: false
            },
            data: top10CityData
          }],
        xAxis: {
          type: 'value',
          axisTick: {
            show: false
          },
          axisLine: {
            show: false
          },
          splitLine: {
            show: false
          },
          axisLabel: {
            show: false
          }
        },
        series: [{
          name: '',
          type: 'bar',
          zlevel: 2,
          barWidth: '6px',
          data: lineY,
          animationDuration: 1500,
          label: {
            normal: {
              show: true,
              position: 'insideBottomRight',
              offset: [20, -8],
              formatter: function (param) {
                return 'TOP' + (parseInt(param.dataIndex) + 1);
              },
              textStyle: {
                color: 'rgba(119, 240, 255, 1)',
                fontSize: '12',
              }
            }
          },
        },
          {
            name: '',
            type: 'bar',
            zlevel: 1,
            barGap: '-100%',
            barWidth: '6px',
            data: [100, 100, 100, 100, 100],
            animationDuration: 1500,
            label: {
              normal: {
                color: '#b3ccf8',
                show: true,
                position: [0, '-20px'],
                textStyle: {
                  fontSize: 12
                },
                formatter: function (a, b) {
                  return a.name
                }
              }
            },
            itemStyle: {
              normal: {
                color: 'rgba(13, 31, 44, 1.00)',
                barBorderRadius: 5,
              }
            },
          },
          {
            name: '左侧',
            type: 'bar',
            zlevel: 2,
            barWidth: "21%",
            barGap: '-105%',
            data: [1, 1, 1, 1, 1],
            itemStyle: {
              normal: {
                color: 'rgba(119, 146, 164, 1)',

              }
            },
          },
        ],
        animationEasing: 'cubicOut'
      }


      myChart.clear();
      myChart.resize();
      myChart.setOption(option);
    },
  }
}
</script>

<style lang="scss" scoped>
.myChart1 {
  position: relative;
  width: 100%;
  height: 100%;
}
</style>