代码
<template>
<div class="echartsB">
<div class="echarts1s" ref="echarts">
</div>
<div class="echartsBr">
<div class="list">
<div class="item" v-for="(item,index) in list" :key="index">
<div class="dian" :style="{'background':color[index]}"></div>
<span>{{ item }}</span>
</div>
</div>
</div>
</div>
</template>
<script>
export default {
name: 'echarts1',
components: {},
props: {
id: {
type: String,
default() {
return ''
}
},
},
data() {
return {
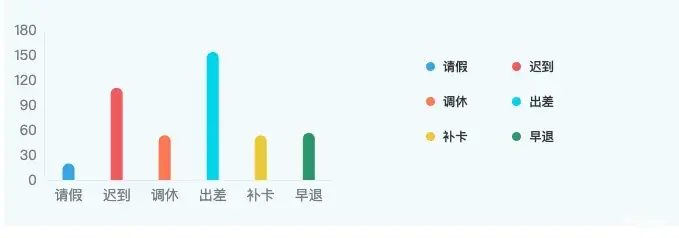
list: ['请假', '迟到', '调休', '出差', '补卡', '早退'],
color: ['#44ADE9', '#EE6666', '#FC8452', '#04D9F2', '#ECD305', '#3BA272']
}
},
watch: {},
mounted() {
this.drawLine()
},
methods: {
drawLine() {
var that = this
window.addEventListener('resize', this.drawLine)
let myChart = this.$echarts.init(this.$refs.echarts)
var option = {
color: this.color,
grid: {
left: '3%',
right: '3%',
top: '15%',
bottom: '10%',
containLabel: true
},
tooltip: {
show: true,
},
xAxis: {
data: ['请假', '迟到', '调休', '出差', '补卡', '早退'],
axisLine: {
show: true,
lineStyle: {
color: '#e9eef0'
}
},
axisTick: {
show: false
},
axisLabel: {
color: '#808A8F',
fontSize: 14
},
},
yAxis: [
{
nameTextStyle: {
color: 'rgba(150, 175, 220, 1)',
fontSize: 13
},
axisLine: {
show: true,
lineStyle: {
color: '#e9eef0'
}
},
axisTick: {
show: false
},
axisLabel: {
color: '#808A8F',
fontSize: 14
},
splitLine: {
show: false,
lineStyle: {
color: '#2d3d53'
}
},
yAxisIndex: 0
}],
series: [
{
type: 'bar',
barWidth: 12,
zlevel: 2,
itemStyle: {
normal: {
color: function (params) {
var list = ['#44ADE9', '#EE6666', '#FC8452', '#04D9F2', '#ECD305', '#3BA272']
return list[params.dataIndex]
},
barBorderRadius: [12, 12, 0, 0],
}
},
label: {
normal: {
show: false,
fontSize: 18,
fontWeight: 'bold',
color: '#ffffff',
position: 'top',
}
},
data: [20, 111, 54, 154, 54, 57]
},
]
}
myChart.clear()
myChart.resize()
myChart.setOption(option)
},
}
}
</script>
<style lang="scss" scoped>
.echarts1s {
position: relative;
width: calc(50% - 0px);
height: 100%;
}
.echartsB {
position: relative;
width: calc(100% - 0px);
height: 100%;
display: flex;
justify-content: center;
align-items: center;
flex-wrap: nowrap;
flex-direction: row;
align-content: flex-start;
}
.echartsBr {
width: 50%;
height: 100%;
position: relative;
display: flex;
justify-content: center;
align-items: center;
flex-wrap: nowrap;
flex-direction: row;
align-content: flex-start;
.list {
position: relative;
width: 70%;
display: flex;
justify-content: center;
align-items: center;
flex-wrap: wrap;
flex-direction: row;
align-content: flex-start;
.item {
margin-right: 50px;
display: flex;
justify-content: flex-start;
align-items: center;
flex-wrap: nowrap;
flex-direction: row;
align-content: flex-start;
margin-bottom: 20px;
.dian {
width: 10px;
height: 10px;
background: #44ADE9;
border-radius: 50%;
margin-right: 9px;
}
span {
font-size: 14px;
font-family: PingFang;
font-weight: 500;
color: #34393C;
}
}
}
}
</style>
github
github