代码
<template>
<div class="echarts1" ref="echarts">
</div>
</template>
<script>
import {FontChart} from "@/utils/utils";
export default {
name: 'echarts1',
components: {},
props: {
id: {
type: String,
default() {
return ''
}
}
},
data() {
return {
status: ''
}
},
watch: {},
mounted() {
this.drawLine()
},
methods: {
drawLine() {
// 基于准备好的dom,初始化echarts实例
window.addEventListener('resize', this.drawLine)
let myChart = this.$echarts.init(this.$refs.echarts)
const CubeLeft = this.$echarts.graphic.extendShape({
shape: {
x: 0,
y: 0
},
buildPath: function (ctx, shape) {
const xAxisPoint = shape.xAxisPoint
const c0 = [shape.x, shape.y]
const c1 = [shape.x - 4.5, shape.y - 4.5]
const c2 = [xAxisPoint[0] - 4.5, xAxisPoint[1] - 4.5]
const c3 = [xAxisPoint[0], xAxisPoint[1]]
ctx.moveTo(c0[0], c0[1]).lineTo(c1[0], c1[1]).lineTo(c2[0], c2[1]).lineTo(c3[0], c3[1]).closePath()
}
})
const CubeRight = this.$echarts.graphic.extendShape({
shape: {
x: 0,
y: 0
},
buildPath: function (ctx, shape) {
const xAxisPoint = shape.xAxisPoint
const c1 = [shape.x, shape.y]
const c2 = [xAxisPoint[0], xAxisPoint[1]]
const c3 = [xAxisPoint[0] + 9, xAxisPoint[1] - 4.5]
const c4 = [shape.x + 9, shape.y - 4.5]
ctx.moveTo(c1[0], c1[1]).lineTo(c2[0], c2[1]).lineTo(c3[0], c3[1]).lineTo(c4[0], c4[1]).closePath()
}
})
const CubeTop = this.$echarts.graphic.extendShape({
shape: {
x: 0,
y: 0
},
buildPath: function (ctx, shape) {
const c1 = [shape.x, shape.y]
const c2 = [shape.x + 9, shape.y - 4.5]
const c3 = [shape.x + 4.5, shape.y - 9]
const c4 = [shape.x - 4.5, shape.y - 4.5]
ctx.moveTo(c1[0], c1[1]).lineTo(c2[0], c2[1]).lineTo(c3[0], c3[1]).lineTo(c4[0], c4[1]).closePath()
}
})
this.$echarts.graphic.registerShape('CubeLeft', CubeLeft)
this.$echarts.graphic.registerShape('CubeRight', CubeRight)
this.$echarts.graphic.registerShape('CubeTop', CubeTop)
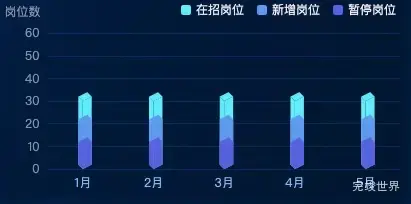
const VALUE = [30,30,30,30,30,30,]
const VALUE2 = [20,20,20,20,20,20,]
const VALUE3 = [10,10,10,10,10,10,]
var option = {
grid: {
left: 40,
right: 20,
bottom: '5%',
top: FontChart(40),
containLabel: true
},
color: ['#72edfd', '#69a0f5', '#5d68e6',],
tooltip: {
show: true,
backgroundColor: '#fff',
borderColor: '#ddd',
borderWidth: 1,
trigger: 'axis',
textStyle: {
color: '#3c3c3c',
fontSize: FontChart(16)
},
},
legend: {
itemWidth: 10,
itemHeight: 10,
itemGap: 13,
show: true,
right: 20,
textStyle: {
fontSize: 12,
color: '#F1F1F3'
}
},
xAxis: {
type: 'category',
data: ['1月', '2月', '3月', '4月', '5月'],
axisLine: {
show: false,
lineStyle: {
color: 'rgba(0, 164, 255, 0.2)',
fontSize: '12px'
}
},
offset: 0,
axisTick: {
show: false,
length: 9,
alignWithLabel: true,
lineStyle: {
color: '#7DFFFD'
}
},
axisLabel: {
fontSize: 12,
color: 'rgba(152, 191, 251, 1)'
},
splitLine: {
show: false,
lineStyle: {color: 'red'}
}
},
yAxis: {
type: 'value',
name: '岗位数',
"nameTextStyle": {
"color": "#8f9cb3",
"padding": [0, 50, 0, 0],
"fontSize": 12
},
axisLine: {
show: false,
lineStyle: {
color: 'white'
}
},
splitLine: {
show: true,
lineStyle: {
color: 'rgba(0, 164, 255, 0.2)',
fontSize: '12px'
}
},
axisTick: {
show: false
},
axisLabel: {
fontSize: 12,
color: '#919eb4'
},
},
series: [
{
type: 'custom',
"stack": "total",
name: '在招岗位',
twinkle: {
enabled: false,
period: 0
},
renderItem: (params, api) => {
const location = api.coord([api.value(0), api.value(1)])
return {
type: 'group',
children: [{
type: 'CubeLeft',
shape: {
api,
xValue: api.value(0),
yValue: api.value(1),
x: location[0],
y: location[1],
xAxisPoint: api.coord([api.value(0), 0])
},
style: {
fill: new this.$echarts.graphic.LinearGradient(0, 0, 0, 1, [{
offset: 0,
color: '#72edfd'
},
{
offset: 1,
color: '#72edfd'
}
])
}
}, {
type: 'CubeRight',
shape: {
api,
xValue: api.value(0),
yValue: api.value(1),
x: location[0],
y: location[1],
xAxisPoint: api.coord([api.value(0), 0])
},
style: {
fill: new this.$echarts.graphic.LinearGradient(0, 0, 0, 1, [{
offset: 0,
color: '#72edfd'
},
{
offset: 1,
color: '#72edfd'
}
])
}
}, {
type: 'CubeTop',
shape: {
api,
xValue: api.value(0),
yValue: api.value(1),
x: location[0],
y: location[1],
xAxisPoint: api.coord([api.value(0), 0])
},
style: {
fill: new this.$echarts.graphic.LinearGradient(0, 0, 0, 1, [{
offset: 0,
color: '#72edfd'
},
{
offset: 1,
color: '#72edfd'
}
])
}
}]
}
},
data: VALUE
},
{
type: 'custom',
"stack": "total",
name: '新增岗位',
twinkle: {
enabled: false,
period: 0
},
renderItem: (params, api) => {
const location = api.coord([api.value(0), api.value(1)])
return {
type: 'group',
children: [{
type: 'CubeLeft',
shape: {
api,
xValue: api.value(0),
yValue: api.value(1),
x: location[0],
y: location[1],
xAxisPoint: api.coord([api.value(0), 0])
},
style: {
fill: new this.$echarts.graphic.LinearGradient(0, 0, 0, 1, [{
offset: 0,
color: '#69a0f5'
},
{
offset: 1,
color: '#69a0f5'
}
])
}
}, {
type: 'CubeRight',
shape: {
api,
xValue: api.value(0),
yValue: api.value(1),
x: location[0],
y: location[1],
xAxisPoint: api.coord([api.value(0), 0])
},
style: {
fill: new this.$echarts.graphic.LinearGradient(0, 0, 0, 1, [{
offset: 0,
color: '#69a0f5'
},
{
offset: 1,
color: '#69a0f5'
}
])
}
}, {
type: 'CubeTop',
shape: {
api,
xValue: api.value(0),
yValue: api.value(1),
x: location[0],
y: location[1],
xAxisPoint: api.coord([api.value(0), 0])
},
style: {
fill: new this.$echarts.graphic.LinearGradient(0, 0, 0, 1, [{
offset: 0,
color: '#69a0f5'
},
{
offset: 1,
color: '#69a0f5'
}
])
}
}]
}
},
data: VALUE2
},
{
type: 'custom',
"stack": "total",
name: '暂停岗位',
twinkle: {
enabled: false,
period: 0
},
renderItem: (params, api) => {
const location = api.coord([api.value(0), api.value(1)])
return {
type: 'group',
children: [{
type: 'CubeLeft',
shape: {
api,
xValue: api.value(0),
yValue: api.value(1),
x: location[0],
y: location[1],
xAxisPoint: api.coord([api.value(0), 0])
},
style: {
fill: new this.$echarts.graphic.LinearGradient(0, 0, 0, 1, [{
offset: 0,
color: '#5d68e6'
},
{
offset: 1,
color: '#5d68e6'
}
])
}
}, {
type: 'CubeRight',
shape: {
api,
xValue: api.value(0),
yValue: api.value(1),
x: location[0],
y: location[1],
xAxisPoint: api.coord([api.value(0), 0])
},
style: {
fill: new this.$echarts.graphic.LinearGradient(0, 0, 0, 1, [{
offset: 0,
color: '#5d68e6'
},
{
offset: 1,
color: '#5d68e6'
}
])
}
}, {
type: 'CubeTop',
shape: {
api,
xValue: api.value(0),
yValue: api.value(1),
x: location[0],
y: location[1],
xAxisPoint: api.coord([api.value(0), 0])
},
style: {
fill: new this.$echarts.graphic.LinearGradient(0, 0, 0, 1, [{
offset: 0,
color: '#5d68e6'
},
{
offset: 1,
color: '#5d68e6'
}
])
}
}]
}
},
data: VALUE3
},
]
}
myChart.clear()
myChart.resize()
myChart.setOption(option)
},
}
}
</script>
<style lang="scss" scoped>
.echarts1 {
position: relative;
width: 100%;
height: 100%;
}
</style>