隐藏前

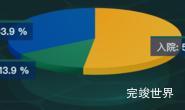
隐藏后
使用enabled控制
dataLabels: {
  padding: 0,
  show: false,
  enabled: false,
  style: {
    color: 'rgba(146, 178, 215, 1)'
  }
},
组件代码
<template>
  <div class="echarts1" id="container" ref="echarts1">

  </div>
</template>

<script>

import Highcharts from "highcharts";

export default {
  name: 'echarts1',
  components: {},
  data() {
    return {}
  },
  mounted() {
    this.drawLine()
  },
  methods: {
    drawLine() {
      var chart = Highcharts.chart('container', {
        title: {
          text: ''
        },
        chart: {
          type: 'pie',
          backgroundColor: 'rgba(0,0,0,0)',
          options3d: {
            enabled: true,
            alpha: 60,
            beta: 0
          }
        },
        colors: ['#8442fd', '#f627ff', '#28d7f0'],
        legend: {
          layout: 'vertical',
          align: 'right',
          verticalAlign: 'middle'
        },
        credits: {
          enabled: false
        },
        tooltip: {
          pointFormat: '{series.name}: <b>{point.percentage:.1f}%</b>'
        },
        plotOptions: {
          pie: {
            allowPointSelect: false,
            cursor: 'pointer',
            depth: 10,
            width: 5,
            lineWidth: 1,
            dataLabels: {
              padding: 0,
              show: false,
              enabled: false,
              style: {
                color: 'rgba(146, 178, 215, 1)'
              }
            },
          }
        },
        series: [{
          type: 'pie',
          name: '故障类型',
          data: [
            ['机电故障', 45],
            ['电气故障', 8],
            ['物料原因', 8],
          ]
        }]
      });
    }
  }
}
</script>

<style lang="scss" scoped>
.echarts1 {
  position: relative;
  width: 50%;
  height: calc(100% - 0px);
}
</style>