在Highcharts中,如果你想在饼图中显示图例,你需要在plotOptions.pie或series.pie中设置showInLegend属性为true。在你的代码中,你可以在plotOptions.pie中添加这个属性,如下所示:
plotOptions: {
  pie: {
    allowPointSelect: true,
    animation: true,
    cursor: 'pointer',
    depth: 25,
    size: '50%',
    center: ['50%', '50%'],
    dataLabels: {
      useHTML: true,
      enabled: true,
      format: '<div class="dataLabels"><b>{point.name}</b>: {point.y}</div>',
      style: {
        color: 'rgba(26, 178, 255, 1)'
      }
    },
    showInLegend: true  // 添加这一行
  }
},
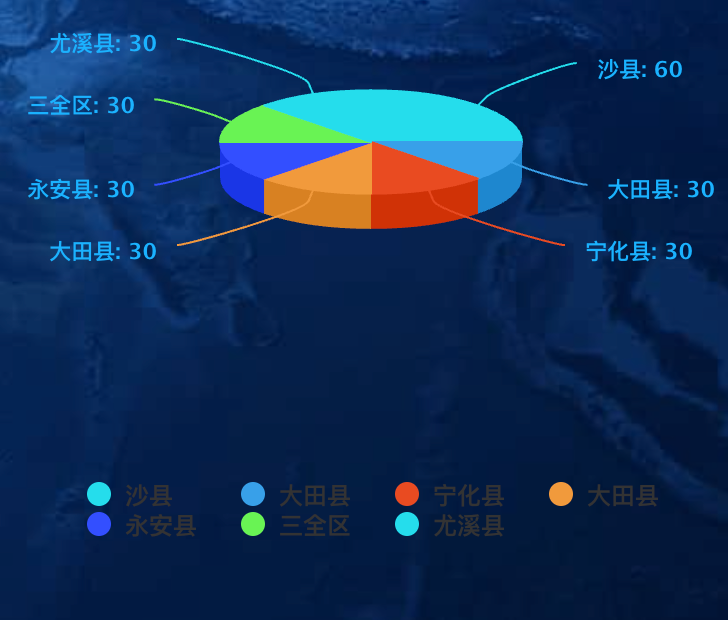
这样,饼图的每个部分都会在图例中显示出来。
接下来我们可以设置legend样式,Highcharts legend图标方块并设置自定义样式.