ID
8
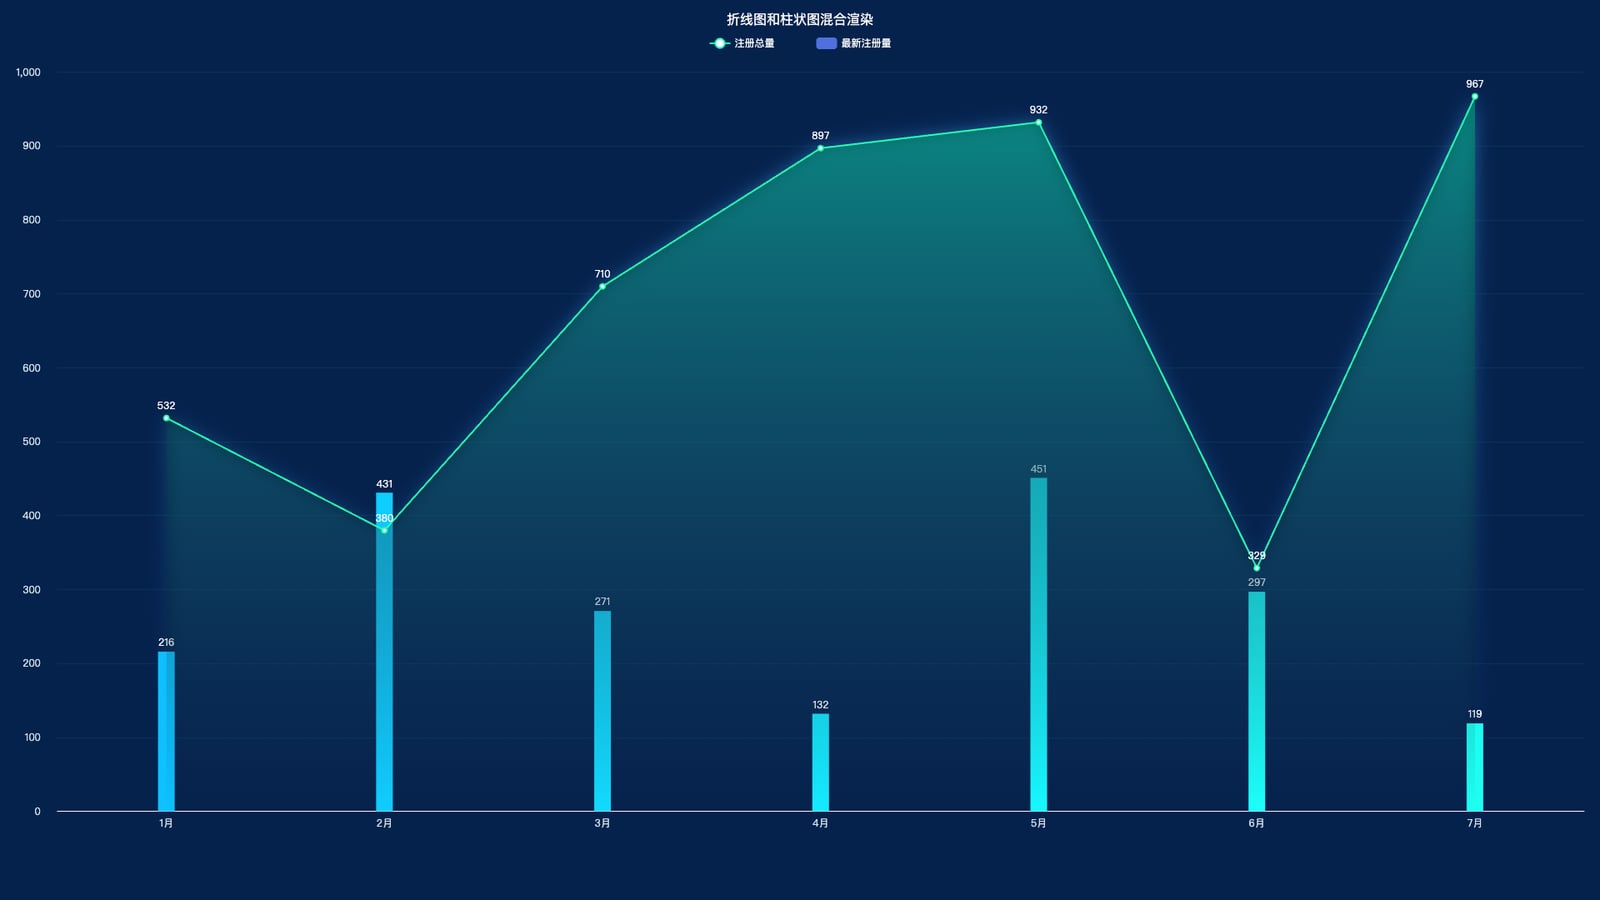
配置代码
const option = {
        backgroundColor: "#05224d",
        tooltip: {},
        grid: {
            top: '8%',
            left: '1%',
            right: '1%',
            bottom: '8%',
            containLabel: true,
        },
        title: {
            text: '折线图和柱状图混合渲染',
            left: 'center',
            top: 10,
            textStyle: {
                color: '#f9f9f9',
                fontSize: 16,
                fontWeight: 400
            }
        },
        legend: {
            top: 40,
            itemGap: 50,
            data: ['注册总量', '最新注册量'],
            textStyle: {
                color: '#f9f9f9',
                borderColor: '#fff'
            },
        },
        xAxis: [{
            type: 'category',
            boundaryGap: true,
            axisLine: {
                show: true,
                lineStyle: {
                    color: '#f9f9f9'
                },
            },
            axisLabel: {
                textStyle: {
                    color: '#d1e6eb',
                    margin: 15,
                },
            },
            axisTick: {
                show: false,
            },
            data: xData,
        }],
        yAxis: [{
            type: 'value',
            min: 0,
            splitNumber: 7,
            splitLine: {
                show: true,
                lineStyle: {
                    color: '#0a3256'
                }
            },
            axisLine: {
                show: false,
            },
            axisLabel: {
                margin: 20,
                textStyle: {
                    color: '#d1e6eb',
                },
            },
            axisTick: {
                show: false,
            },
        }],
        series: [
            {
                name: '注册总量',
                type: 'line',
                showAllSymbol: true,
                symbol: 'emptyCircle',
                symbolSize: 6,
                lineStyle: {
                    normal: {
                        color: "#28ffb3",
                    },
                    borderColor: '#f0f'
                },
                label: {
                    show: true,
                    position: 'top',
                    textStyle: {
                        color: '#fff',
                    }
                },
                itemStyle: {
                    normal: {
                        color: "#28ffb3",
                    }
                },
                tooltip: {
                    show: true
                },
                areaStyle: {
                    normal: {
                        color: new echarts.graphic.LinearGradient(
                            0, 0, 0, 1,
                            [
                                { offset: 0, color: 'rgba(0,154,120,1)' },
                                { offset: 1, color: 'rgba(0,0,0,0)' }
                            ],
                            false
                        ),
                        shadowColor: 'rgba(53,142,215,0.9)',
                        shadowBlur: 20
                    }
                },
                data: lineData
            },
            {
                name: '最新注册量',
                type: 'bar',
                barWidth: 20,
                tooltip: {
                    show: true
                },
                label: {
                    show: true,
                    position: 'top',
                    textStyle: {
                        color: '#fff',
                    }
                },
                itemStyle: {
                    normal: {
                        color: function (params) {
                            const colorList = [
                                '#0ec1ff', '#10cdff', '#12daff',
                                '#15ebff', '#17f8ff', '#1cfffb', '#1dfff1'
                            ];
                            return colorList[params.dataIndex % colorList.length];
                        }
                    }
                },
                data: barData
            }
        ]
    };
完整示例代码
相关文件下载地址


