ECharts折线图大数据量面积图

echarts折线图

ECharts折线图大数据量面积图

ID

33

配置代码

var option = {
        tooltip: {
            trigger: 'axis',
            position: function (pt) {
                return [pt[0], '10%'];
            }
        },
        title: {
            left: 'center',
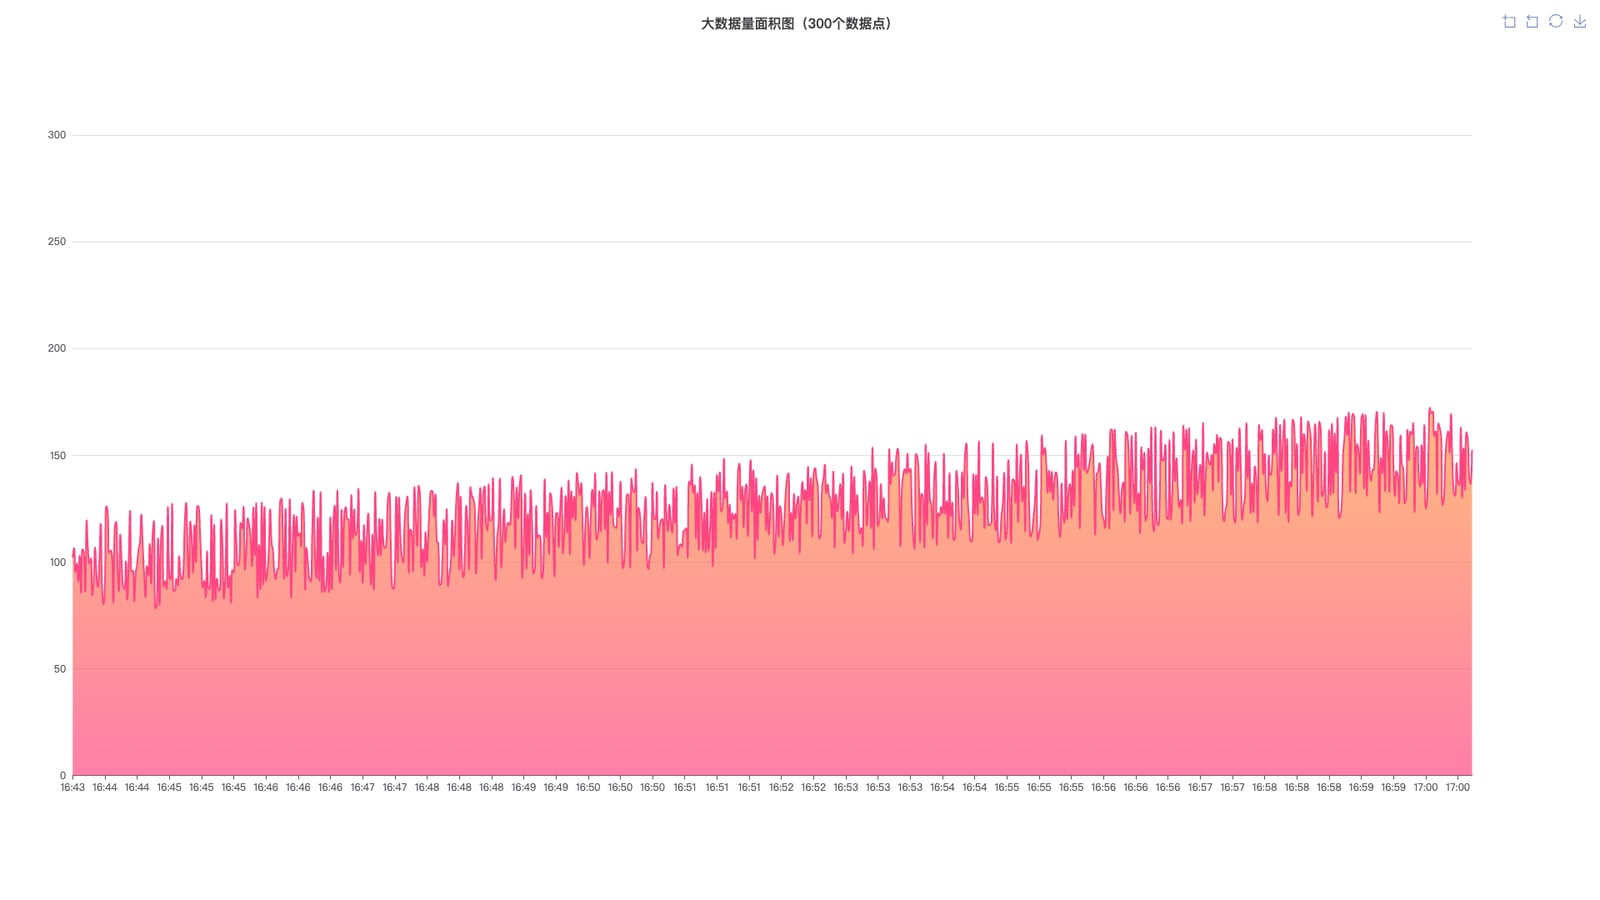
            text: '大数据量面积图(300个数据点)',
            textStyle: {
                fontSize: 16,
                fontWeight: 'bold'
            }
        },
        toolbox: {
            feature: {
                dataZoom: {
                    yAxisIndex: 'none'
                },
                restore: {},
                saveAsImage: {}
            }
        },
        grid: {
            left: '3%',
            right: '8%',
            bottom: '12%',
            top: '15%',
            containLabel: true
        },
        xAxis: {
            type: 'category',
            boundaryGap: false,
            data: bigData.date,
            axisLabel: {
                formatter: function(value) {
                    return value.slice(0, 5); // 显示 HH:MM
                }
            }
        },
        yAxis: {
            type: 'value',
            boundaryGap: [0, '100%']
        },
        series: [
            {
                name:'模拟数据',
                type:'line',
                smooth:true,
                symbol: 'none',
                sampling: 'average',
                itemStyle: {
                    normal: {
                        color: 'rgb(255, 70, 131)'
                    }
                },
                areaStyle: {
                    normal: {
                        color: new echarts.graphic.LinearGradient(0, 0, 0, 1, [{
                            offset: 0,
                            color: 'rgb(255, 158, 68)'
                        }, {
                            offset: 1,
                            color: 'rgb(255, 70, 131)'
                        }])
                    }
                },
                data: bigData.data
            }
        ]
    };

完整示例代码

相关文件下载地址
喜欢
ECharts折线图大数据量面积图