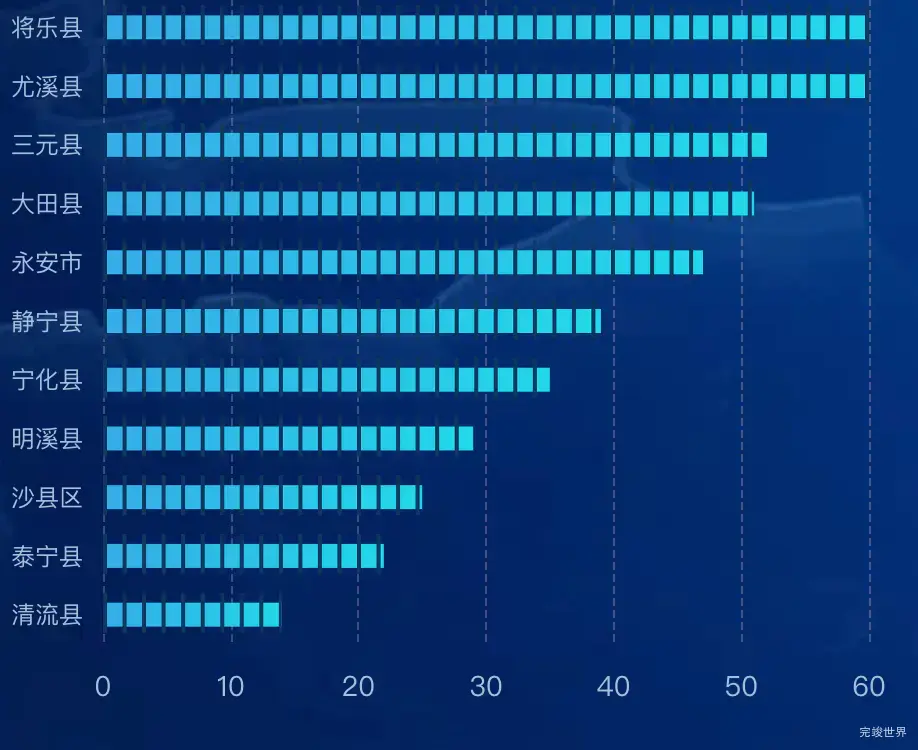
echarts柱状图效果,横向渐变色柱状图,并且柱状图会被均匀分割成不同的小方格。
实例代码
<template>
  <div class="echarts1" ref="echarts">

  </div>
</template>

<script>
import * as echarts from "echarts"

export default {
  name: 'echarts1',
  components: {},
  data() {
    return {
      list: [],
      colorList: [
        "rgba(17, 251, 237, 1.00)",
        "rgba(38, 255, 82, 1.00)",
        "rgba(228, 251, 36, 1.00)",
        "rgba(255, 185, 36, 1.00)",
        "rgba(31, 115, 255, 1.00)"
      ]
    }
  },
  mounted() {
    let addressList = ["永安市", "静宁县", "泰宁县", "将乐县", "沙县区", "尤溪县", "大田县", "宁化县", "清流县", "明溪县", "三元县"];
    this.list = addressList.map(name => {
      return {
        name: name,
        value: Math.floor(Math.random() * 100) + 1
      };
    });
    this.list.sort((a, b) => a.value - b.value);
    this.drawLine()
  },
  methods: {
    drawLine() {
      var that = this;
      // 基于准备好的dom,初始化echarts实例
      window.addEventListener('resize', this.drawLine)
      const myChart = echarts.init(this.$refs.echarts)
      var option = {
        tooltip: {
          show: false,
        },
        animation: false,
        grid: {
          right: 20,
          containLabel: true,
          left: 10,
          top: "10",
          bottom: "20"
        },
        xAxis: {
          type: "value",
          gridIndex: 0,
          min: 0,
          max: 60,
          interval: 10,
          splitLine: {
            show: true,
            lineStyle: {
              type: 'dashed',
              color: 'rgba(255, 255, 255, 0.2)',
              width: 1
            },
          },
          axisLine: {
            show: false,
          },
          axisTick: {
            show: false,
          },
          axisLabel: {
            show: true,
            margin: 14,
            fontSize: 14,
            textStyle: {
              color: "#A3C0DF" //X轴文字颜色
            },
          },
        },
        yAxis: {
          data: this.list.map(obj => obj.name),
          axisLine: {
            show: false,
          },
          axisTick: {
            show: false
          },
          axisLabel: {
            show: true,
            interval: 0,
            margin: 10,
            fontSize: 12,
            textStyle: {
              color: "#A3C0DF", //Y轴文字颜色
              lineHeight: 18
            },
            formatter: function (value) {
              return value.length > 4 ? value.substring(0, 4) + '\n' + value.substring(4) : value;
            }
          },
        },
        series: [
          {
            name: "",
            type: "bar",
            barWidth: 12,
            showBackground: true,
            backgroundStyle: {
              color: 'transparent',
              borderColor: 'rgba(2, 43, 88, 1.00)',
              borderWidth: 0,
              borderType: 'solid'
            },
            itemStyle: {
              normal: {
                color: new echarts.graphic.LinearGradient(
                    0, 0, 1, 0, // 渐变方向从左(0)到右(1)
                    [
                      {offset: 0, color: 'rgba(54, 171, 231, 1)'}, // 渐变起始颜色
                      {offset: 1, color: 'rgba(34, 215, 234, 1)'} // 渐变结束颜色
                    ]
                )
              },
              decal: {
                show: false,
                symbol: 'circle',
                symbolSize: [60, 0],
              },
            },
            data: this.list.map(obj => obj.value),
            z: 10,
            zlevel: 0,
            label: {
              show: false,
              position: "right",
              distance: 10,
              fontSize: 16,
              color: '#fff',
              fontFamily: 'UniDream'
            }
          },
          {
            // 分隔
            type: 'pictorialBar',
            itemStyle: {
              normal: {
                color: "#0F375F"
              }
            },
            symbolRepeat: 'fixed',
            symbolMargin: 4,
            symbol: 'rect',
            symbolClip: true,
            symbolSize: [2, 20],
            symbolPosition: "start",
            symbolOffset: [0, -1],
            // symbolBoundingData: this.total,
            data: this.list.map(obj => obj.value),
            width: 10,
            z: 0,
            zlevel: 1,
          },
        ]
      }
      myChart.clear()
      myChart.resize()
      myChart.setOption(option)
    }
  }
}
</script>

<style lang="scss" scoped>
.echarts1 {
  position: relative;
  width: 100%;
  height: 100%;
}
</style>


