ID
7
配置代码
const option = {
color: color,
title: {
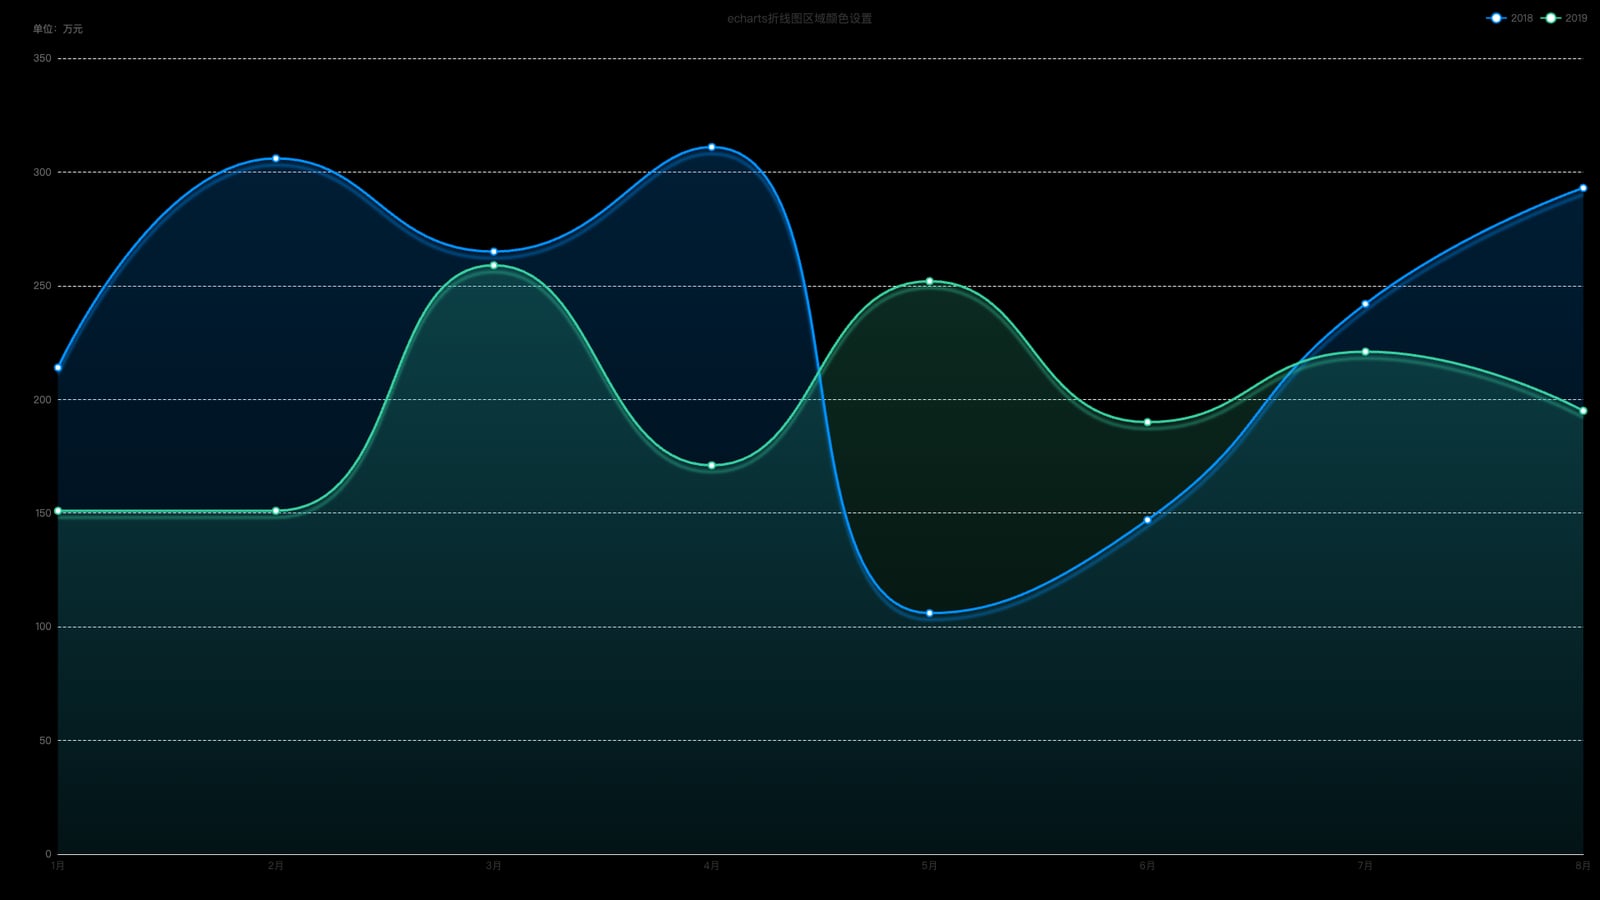
text: 'echarts折线图区域颜色设置',
left: 'center',
top: 10,
textStyle: { color: '#333', fontSize: 14, fontWeight: 400 }
},
legend: {
right: 10,
top: 10,
data: ['2018', '2019']
},
tooltip: {
trigger: "axis",
axisPointer: {
type: 'line'
},
formatter: function (params) {
// params: axis 触发时是数组
const name = params[0]?.name ?? '';
let html = `<div style="font-size:14px;line-height:22px;color:#333">${name}月</div>`;
params.forEach(p => {
html += `
<div style="font-size:14px;line-height:24px;color:#666">
<span style="display:inline-block;margin-right:6px;border-radius:50%;width:10px;height:10px;background:${p.color};
完整示例代码
相关文件下载地址


