数据可视化大屏 项目开发中,为了能够快速应用到项目中,项目开发中遇到各种样式的饼状图,都会整理出来,后期遇到类似的效果,就可以直接拿过来微调使用,而不需要重头开始,节省时间。
饼状图需求描述
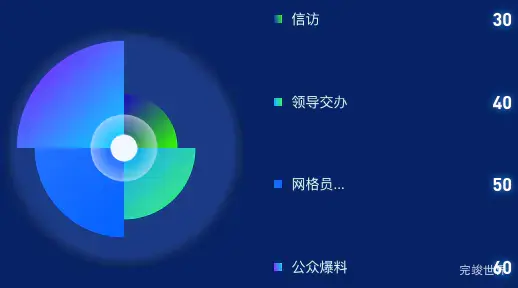
左侧饼状图 饼状图颜色渐变,饼状图随着数据多少显示不同的大小,饼状图中间有白色圆点,圆点外层有一个光圈,饼状图最外层有一个渐变色的环形背景。
右侧legend 使用html自定义实现。
组件代码
<template>
  <div class="echartsBodys">
    <echarts1 title="总数" :total="total" :list="list" ref="echarts"></echarts1>
    <div class="list">
      <div class="listItem cur" @click="getChecked(index)" v-for="(item,index) in list" :key="index">
        <div class="listIteml">
          <div class="dot" :class="{disabled:!item.checked}"
               :style="'background: linear-gradient(80deg,'+item.color1+' 0%, '+item.color2+' 100%);'"></div>
          <span :class="{disabled:!item.checked}">{{ item.name }}</span>
        </div>
        <em class="num"
            v-if="item.checked">{{
            item.value
          }}</em>
        <em class="num"
            v-else>{{
            item.value
          }}</em>
      </div>
    </div>
  </div>
</template>

<script>
import echarts1 from "./components/echarts.vue";

export default {
  name: "echarts",
  data() {
    return {
      list: [
        {
          name: '信访',
          value: 30,
          color1: 'rgba(31, 0, 188, 1)',
          color2: 'rgba(48, 255, 0, 1)',
          checked: true
        },
        {
          name: '领导交办',
          value: 40,
          color1: 'rgba(0, 162, 255, 1)',
          color2: 'rgba(0, 255, 96, 1)',
          checked: true
        },
        {
          name: '网格员...',
          value: 50,
          color1: 'rgba(36, 113, 255, 1)',
          color2: 'rgba(0, 96, 255, 1)',
          checked: true
        },
        {
          name: '公众爆料',
          value: 60,
          color1: 'rgba(150, 0, 255, 1)',
          color2: 'rgba(0, 216, 255, 1)',
          checked: true
        }]
    }
  },
  computed: {
    total: function () {
      var total = 0
      this.list.forEach((type) => {
        total += type.value
      });
      return total
    }
  },
  components: {echarts1},
  props: {
    title: {
      type: String,
      default() {
        return '';
      }
    },
    icon: {
      type: String,
      default() {
        return '';
      }
    },
  },
  methods: {
    getChecked(index) {
      this.list[index].checked = !this.list[index].checked
      this.$refs.echarts.drawEcharts()
    }
  },
}
</script>

<style lang="scss" scoped>
.list {
  margin-left: 0px;
  position: relative;
  width: calc(50% - 0px);
  margin-right: 0px;
  height: calc(100% - 20px);
  margin-bottom: 10px;
  display: flex;
  justify-content: space-between;
  align-items: center;
  flex-wrap: nowrap;
  flex-direction: column;
  align-content: flex-start;

  .listItem {
    font-size: 14px;
    display: flex;
    height: 30%;
    width: calc(100% - 30px);
    margin: 0 auto;
    justify-content: space-between;
    align-items: center;
    flex-wrap: nowrap;
    flex-direction: row;
    align-content: flex-start;

    .listIteml {
      display: flex;
      justify-content: flex-start;
      align-items: center;
      flex-wrap: nowrap;
      flex-direction: row;
      align-content: flex-start;
      font-size: 14px;
      font-family: MicrosoftYaHei;
      font-weight: 400;
      color: #FFFFFF;
    }

    span {
      font-size: 14px;
      font-family: PingFang SC-Regular, PingFang SC;
      font-weight: 400;
      color: #E0F9FF;
      line-height: 20px;
    }

    .dot {
      width: 8px;
      height: 8px;
      margin-right: 10px;
      flex-shrink: 0;
    }

    .dot.disabled {
      background: rgba(#999, 0.8) !important;
    }

    span.disabled {
      color: rgba(#999, 0.8) !important;
    }

    .num {
      font-size: 18px;
      font-family: DIN-Bold;
      font-weight: 500;
      color: #FFFFFF;
      text-shadow:0 0 8px #2a95f5;
      //background: linear-gradient(0deg, rgba(#999, 0.8) 0.1220703125%, rgba(#999, 0.8) 100%);
      //-webkit-background-clip: text;
      //-webkit-text-fill-color: transparent;
    }
  }
}

.echartsBodys {
  width: 100%;
  position: relative;
  height: 100%;
  display: flex;
  justify-content: space-between;
  align-items: center;
  flex-wrap: nowrap;
  flex-direction: row;
  align-content: flex-start;
}
</style>
echarts 组件代码
<template>
  <div class="echartsBody">
    <div class="echartsBody1" ref="echarts1"></div>
  </div>
</template>

<script>
import * as echarts from "echarts"

export default {
  name: 'echarts1',
  components: {},
  data() {
    return {}
  },
  props: {
    list: {
      type: Array,
      default() {
        return [];
      }
    },
    shadowColor: {
      type: String,
      default() {
        return 'rgba(254, 175, 87, 0.5)';
      }
    },
  },
  mounted() {
    var that = this;
    const viewElem = document.body;
    // 监听窗口变化,重绘echarts
    const resizeObserver = new ResizeObserver(() => {
      setTimeout(() => {
        that.drawEcharts();
      }, 300)
    });
    resizeObserver.observe(viewElem);
  },
  computed: {
    colorList: function () {
      var that = this;
      var colorList = []
      that.list.forEach((type) => {
            if (type.checked) {
              var color = new echarts.graphic.LinearGradient(0, 0, 1, 1, [{
                offset: 0,
                color: type.color1
              }, {
                offset: 1,
                color: type.color2
              }])
              colorList.push(color)
            }
          }
      );
      return colorList
    }
  },
  methods: {
    drawEcharts() {
      var that = this
      let myChart = echarts.init(this.$refs.echarts1)
      var colors = this.colorList
      var data = []
      that.list.forEach((type) => {
        if (type.checked) {
          var datas = {
            ...type,
            itemStyle: {
              normal: {
                borderColor: new echarts.graphic.LinearGradient(0, 0, 1, 1, [{
                  offset: 0,
                  color: type.color1
                }, {
                  offset: 1,
                  color: type.color2
                }]),
                shadowColor: that.shadowColor
              }
            }
          }
          data.push(datas)
        }
      });
      var option = {
        color: colors,
        tooltip: {
          trigger: 'item',
          // formatter: '{a} {b} : {c} ({d}%)'
        },
        series: [
          {
            type: 'pie',
            roseType: 'area',
            center: ['50%', '50%'],
            radius: ['0%', '80%'],
            labelLine: {
              normal: {
                length: 20
              }
            },
            label: {
              show: false,
              position: 'inside',
              formatter: '{d}%',
              color: '#fff',
              fontSize: 16
            },
            itemStyle: {
              normal: {
                borderColor: '#3eebc4',
                borderWidth: 0
              }
            },
            data: data
          },
          // 圆点背景
          {
            type: 'pie',
            name: '饼状背景',
            z: 2,
            radius: ['0%', '10%'],
            center: ['50%', '50%'],
            startAngle: 110,
            hoverAnimation: false,
            itemStyle: {
              normal: {
                color: new echarts.graphic.LinearGradient(0, 0, 1, 1, [{
                  offset: 0,
                  color: '#f3f7ff'
                }, {
                  offset: 1,
                  color: '#f3f7ff'
                }])
              },
            },
            tooltip: {
              show: false,
            },
            label: {
              show: false
            },
            data: [50]
          },
          // 圆点外围渐变光圈
          {
            type: 'pie',
            name: '饼状背景',
            z: 2,
            radius: ['0%', '25%'],
            center: ['50%', '50%'],
            startAngle: 110,
            hoverAnimation: false,
            itemStyle: {
              normal: {
                color: new echarts.graphic.RadialGradient(.5, .5, 0.5, [{
                  offset: 0,
                  color: 'rgba(233, 239, 255, 0.1)'
                },
                  {
                    offset: 0.5,
                    color: 'rgba(233, 239, 255, 0.1)'
                  }, {
                    offset: 0.9,
                    color: 'rgba(233, 239, 255, 0.42)'
                  },
                  {
                    offset: 1,
                    color: 'rgba(233, 239, 255, 0.6)'
                  }
                ], false),
              }
            },
            tooltip: {
              show: false,
            },
            label: {
              show: false
            },
            data: [50]
          },
          // 饼状图最外层环形光晕
          {
            type: 'pie',
            name: '饼状背景',
            z: 0,
            radius: ['0%', '90%'],
            center: ['50%', '50%'],
            startAngle: 110,
            hoverAnimation: false,
            itemStyle: {
              normal: {
                color: new echarts.graphic.RadialGradient(.5, .5, 0.5, [{
                  offset: 0,
                  color: 'rgba(72, 108, 199, 0.3)'
                },
                  {
                    offset: 0.5,
                    color: 'rgba(72, 108, 199, 0.3)'
                  }, {
                    offset: 0.9,
                    color: 'rgba(72, 108, 199, 0.3)'
                  },
                  {
                    offset: 1,
                    color: 'rgba(30, 37, 53, 0.3)'
                  }
                ], false),
              }
            },
            tooltip: {
              show: false,
            },
            label: {
              show: false
            },
            data: [50]
          },
        ]
      }
      myChart.clear()
      myChart.resize()
      myChart.setOption(option)
    },
  }
}
</script>

<style lang="scss" scoped>
.echartsBody {
  position: relative;
  width: 50%;
  height: calc(100% - 0px);

  .echartsBody1 {
    position: relative;
    width: 100%;
    height: calc(100% - 0px);
  }

  .echartsBody2 {
    position: absolute;
    top: 0;
    left: 0;
    width: 100%;
    height: calc(100% - 0px);
    display: flex;
    justify-content: center;
    align-items: center;
    flex-wrap: nowrap;
    flex-direction: column;
    align-content: flex-start;
    pointer-events: none;

    .echartsTitle {
      font-size: 30px;
      font-family: DIN;
      font-weight: normal;
      color: #FFFFFF;
      text-shadow: 0 0 10px rgba(120, 168, 238, 1.00);
    }

    .echartsDesc {
      font-size: 14px;
      font-family: MicrosoftYaHei;
      font-weight: 400;
      color: #9DB9E9;
    }
  }
}
</style>