数据大屏 项目开发中,有一个饼状图需求:
饼状图需求描述
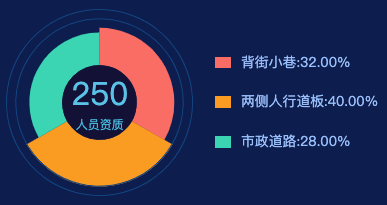
左侧饼状图两层边线描述,为了让标题能够一直处在饼状图中心,饼状图中心为黑色背景,饼状图和legend是分开的。
饼状图中心有总数以及说明文字
右侧legend 使用html自定义实现。自定义legend可以选中高亮,不选中置灰。echarts也会同步变化。
组件代码
<template>
  <div class="echartsBodys">
    <echarts1 title="总数" :total="total" :list="list" ref="echarts"></echarts1>
    <div class="list">
      <div class="listItem cur" @click="getChecked(index)" v-for="(item,index) in list" :key="index">
        <div class="listIteml">
          <div class="dot" :class="{disabled:!item.checked}"
               :style="'background: linear-gradient(0deg,'+item.color1+' 0%, '+item.color2+' 100%);'"></div>
          <span :class="{disabled:!item.checked}">{{ item.name }}:</span>
        </div>
        <div class="num"
             :class="{disabled:!item.checked}">
          <proportion :list="list" :value="item.value"></proportion>
        </div>
      </div>
    </div>
  </div>
</template>

<script>

import echarts1 from "./components/echarts.vue";
import proportion from "./proportion.vue";

export default {
  name: "title",
  data() {
    return {
      list: [
        {
          name: '背街小巷',
          value: 80,
          color1: 'rgba(249, 109, 101, 1)',
          color2: 'rgba(249, 109, 101, 1)',
          checked: true
        },
        {
          name: '两侧人行道板',
          value: 100,
          color1: 'rgba(250, 155, 34, 1)',
          color2: 'rgba(250, 155, 34, 1)',
          checked: true
        },
        {
          name: '市政道路',
          value: 70,
          color1: 'rgba(60, 213, 179, 1)',
          color2: 'rgba(60, 213, 179, 1)',
          checked: true
        }]
    }
  },
  computed: {
    total: function () {
      var total = 0
      this.list.forEach((type) => {
        total += type.value
      });
      return total
    }
  },
  components: {echarts1, proportion},
  props: {
    title: {
      type: String,
      default() {
        return '';
      }
    },
    icon: {
      type: String,
      default() {
        return '';
      }
    },
  },
  watch: {},
  mounted() {
    var that = this;
  },
  methods: {
    getChecked(index) {
      this.list[index].checked = !this.list[index].checked
      this.$refs.echarts.drawEcharts()
    }
  },
}
</script>

<style lang="scss" scoped>
.list {
  margin-left: 0px;
  position: relative;
  width: 45%;
  height: calc(100% - 10px);
  //background: url("./assets/jiaobiaobg.png") no-repeat;
  //background-size: 100% 100%;
  display: flex;
  justify-content: center;
  align-items: center;
  flex-wrap: nowrap;
  flex-direction: column;
  align-content: flex-start;

  .listItem {
    font-size: 14px;
    display: flex;
    width: calc(100% - 0px);
    margin: 10px auto;
    justify-content: flex-start;
    align-items: center;
    flex-wrap: nowrap;
    flex-direction: row;
    align-content: flex-start;

    .listIteml {
      display: flex;
      justify-content: flex-start;
      align-items: center;
      flex-wrap: nowrap;
      flex-direction: row;
      align-content: flex-start;
      font-size: 13px;
      font-family: MicrosoftYaHei;
      font-weight: 400;
      color: rgba(152, 191, 251, 1);
    }

    span {
      font-size: 14px;
      font-family: PingFang SC-Regular, PingFang SC;
      font-weight: 400;
      color: rgba(152, 191, 251, 1);
      display: flex;
      justify-content: flex-start;
      align-items: center;
      flex-wrap: nowrap;
      flex-direction: row;
      align-content: flex-start;
    }

    .dot {
      width: 16px;
      height: 12px;
      margin-right: 10px;
      flex-shrink: 0;
    }

    .dot.disabled {
      background: rgba(#999, 0.8) !important;
    }

    .disabled span, span.disabled {
      color: rgba(#999, 0.8) !important;
    }
  }
}

.echartsBodys {
  width: 100%;
  position: relative;
  height: 100%;
  display: flex;
  justify-content: space-between;
  align-items: center;
  flex-wrap: nowrap;
  flex-direction: row;
  align-content: flex-start;
}
</style>
echarts代码
<template>
  <div class="echartsBody">
    <div class="echartsBody1" ref="echarts1"></div>
    <div class="echartsBody2">
      <div class="echartsTitle">{{ total }}</div>
      <div class="echartsDesc">{{ title }}</div>
    </div>
  </div>
</template>

<script>
import * as echarts from "echarts"

export default {
  name: 'echarts1',
  components: {},
  data() {
    return {}
  },
  props: {
    list: {
      type: Array,
      default() {
        return [];
      }
    },
    shadowColor: {
      type: String,
      default() {
        return 'rgba(254, 175, 87, 0.5)';
      }
    },
    title: {
      type: String,
      default() {
        return '总数';
      }
    },
    total: {
      type: String,
      default() {
        return 0;
      }
    },
  },
  mounted() {
    var that = this;
    const viewElem = document.body;
    // 监听窗口变化,重绘echarts
    const resizeObserver = new ResizeObserver(() => {
      setTimeout(() => {
        that.drawEcharts();
      }, 300)
    });
    resizeObserver.observe(viewElem);
  },
  computed: {
    colorList: function () {
      var that = this;
      var colorList = []
      that.list.forEach((type) => {
            if (type.checked) {
              var color = new echarts.graphic.LinearGradient(0, 0, 1, 1, [{
                offset: 0,
                color: type.color1
              }, {
                offset: 1,
                color: type.color2
              }])
              colorList.push(color)
            }
          }
      );
      return colorList
    }
  },
  methods: {
    drawEcharts() {
      var that = this
      let myChart = echarts.init(this.$refs.echarts1)
      var colors = this.colorList
      var data = []
      var placeHolderStyle = {
        normal: {
          label: {
            show: false
          },
          labelLine: {
            show: false
          },
          color: 'rgba(0, 0, 0, 0)',
          borderColor: 'rgba(0, 0, 0, 0)',
          borderWidth: 0
        }
      };
      that.list.forEach((type) => {
        if (type.checked) {
          var datas = {
            ...type,
            itemStyle: {
              normal: {
                borderColor: new echarts.graphic.LinearGradient(0, 0, 1, 1, [{
                  offset: 0,
                  color: type.color1
                }, {
                  offset: 1,
                  color: type.color2
                }]),
                shadowColor: that.shadowColor
              }
            }
          }
          data.push(datas)
        }
      });
      var option = {
        color: colors,
        tooltip: {
          trigger: 'item',
          // formatter: '{a} {b} : {c} ({d}%)'
        },
        series: [
          {
            type: 'pie',
            roseType: 'area',
            center: ['50%', '50%'],
            radius: ['40%', '90%'],
            labelLine: {
              normal: {
                length: 20
              }
            },
            label: {
              show: false,
              position: 'inside',
              formatter: '{d}%',
              color: '#fff',
              fontSize: 16
            },
            itemStyle: {
              normal: {
                borderColor: '#3eebc4',
                borderWidth: 0
              }
            },
            data: data
          },
          {
            type: 'pie',
            name: '中间黑色背景',
            radius: ['0%', '40%'],
            center: ['50%', '50%'],
            startAngle: 110,
            hoverAnimation: false,
            itemStyle: {
              normal: {
                color: new echarts.graphic.LinearGradient(0, 0, 1, 1, [{
                  offset: 0,
                  color: '#141136'
                }, {
                  offset: 1,
                  color: '#141136'
                }]),
              },
            },
            tooltip: {
              show: false,
            },
            label: {
              show: false
            },
            data: [50]
          },
          {
            type: 'pie',
            name: '最外层蓝色边线',
            radius: ['99%', '100%'],
            center: ['50%', '50%'],
            startAngle: 110,
            hoverAnimation: false,
            itemStyle: {
              normal: {
                color: new echarts.graphic.LinearGradient(0, 0, 1, 1, [{
                  offset: 0,
                  color: '#12437f'
                }, {
                  offset: 1,
                  color: '#12437f'
                }]),
              },
            },
            tooltip: {
              show: false,
            },
            label: {
              show: false
            },
            data: [50]
          },
          {
            type: 'pie',
            name: '第二层边线',
            radius: ['89%', '90%'],
            center: ['50%', '50%'],
            startAngle: 110,
            hoverAnimation: false,
            itemStyle: {
              normal: {
                color: new echarts.graphic.LinearGradient(0, 0, 1, 1, [{
                  offset: 0,
                  color: '#12437f'
                }, {
                  offset: 1,
                  color: '#12437f'
                }]),
              },
            },
            tooltip: {
              show: false,
            },
            label: {
              show: false
            },
            data: [50]
          },
        ]
      }
      myChart.clear()
      myChart.resize()
      myChart.setOption(option)
    },
  }
}
</script>

<style lang="scss" scoped>
.echartsBody {
  position: relative;
  width: 60%;
  height: calc(100% - 0px);

  .echartsBody1 {
    position: relative;
    width: 100%;
    height: calc(100% - 0px);
  }
}

.echartsBody2 {
  position: absolute;
  top: 0;
  left: 0;
  width: 100%;
  height: calc(100% - 0px);
  display: flex;
  justify-content: center;
  align-items: center;
  flex-wrap: nowrap;
  flex-direction: column;
  align-content: flex-start;
  pointer-events: none;

  .echartsTitle {
    font-size: 32px;
    font-family: DIN-Bold;
    font-weight: normal;
    color: #59c2e6;
  }

  .echartsDesc {
    font-size: 12px;
    font-family: MicrosoftYaHei;
    font-weight: 400;
    color: rgba(72, 179, 217, 1);
  }
}
</style>
百分比组件代码
<template>
  <span>{{ proportion }}%</span>
</template>

<script>
export default {
  name: "proportion",
  data() {
    return {}
  },
  computed: {
    proportion: function () {
      var total = 0
      this.list.forEach((type) => {
        total += type.value
      });
      return ((this.value / total) * 100).toFixed(2)
    }
  },
  components: {},
  props: {
    list: {
      type: Array,
      default() {
        return [];
      }
    },
    value: {
      type: Number,
      default() {
        return 0;
      }
    }
  },
  methods: {},
}
</script>


