数据看板 项目开发中,有一个饼状图需求:
饼状图需求描述
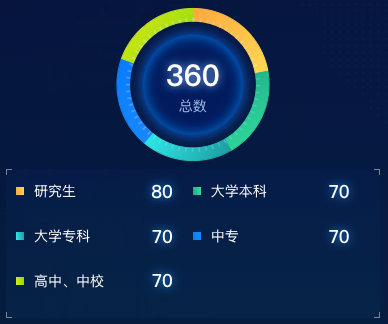
效果如下图:
上面是饼状图,饼状图中心有总数以及标题
下面是自定义legend 使用html自定义实现。自定义legend两行显示。数字有发光效果。
组件代码
<template>
  <div class="echartsBodys">
    <echarts1 title="总数" :total="total" :list="list" ref="echarts"></echarts1>
    <div class="list">
      <bg></bg>
      <div class="listItem cur" @click="getChecked(index)" v-for="(item,index) in list" :key="index">
        <div class="listIteml">
          <div class="dot" :class="{disabled:!item.checked}"
               :style="'background: linear-gradient(80deg,'+item.color1+' 0%, '+item.color2+' 100%);'"></div>
          <span :class="{disabled:!item.checked}">{{ item.name }}</span>
        </div>
        <em class="num"
            v-if="item.checked">{{
            item.value
          }}</em>
        <em class="num"
            v-else>{{
            item.value
          }}</em>
      </div>
    </div>
  </div>
</template>

<script>
import WOW from "wow.js";
import echarts1 from "./components/echarts.vue";
import bg from './components/bg.vue'

export default {
  name: "title",
  data() {
    return {
      list: [
        {
          name: '常住户数',
          value: 80,
          color1: 'rgba(253, 168, 62, 1)',
          color2: 'rgba(254, 217, 82, 1)',
          checked: true
        },
        {
          name: '管住户数',
          value: 70,
          color1: 'rgba(8, 170, 135, 1)',
          color2: 'rgba(14, 224, 159, 1)',
          checked: true
        },
        {
          name: '流出户数',
          value: 70,
          color1: 'rgba(15, 234, 234, 1)',
          color2: 'rgba(11, 155, 159, 1)',
          checked: true
        },
        {
          name: '一般农户数',
          value: 70,
          color1: 'rgba(8, 124, 255, 1)',
          color2: 'rgba(25, 137, 251, 1)',
          checked: true
        },
        {
          name: '预警户数',
          value: 70,
          color1: 'rgba(221, 234, 15, 1)',
          color2: 'rgba(140, 217, 18, 1)',
          checked: true
        }]
    }
  },
  computed: {
    total: function () {
      var total = 0
      this.list.forEach((type) => {
        total += type.value
      });
      return total
    }
  },
  components: {echarts1, bg},
  props: {
    title: {
      type: String,
      default() {
        return '';
      }
    },
    icon: {
      type: String,
      default() {
        return '';
      }
    },
  },
  watch: {},
  mounted() {
    var that = this;
    var wow = new WOW({
      boxClass: "wow", // animated element css class (default is wow)
      animateClass: "animated", // animation css class (default is animated)
      offset: 0, // distance to the element when triggering the animation (default is 0)
      mobile: true, // trigger animations on mobile devices (default is true)
      live: true, // act on asynchronously loaded content (default is true)
      callback: function (box) {
        // the callback is fired every time an animation is started
        // the argument that is passed in is the DOM node being animated
      },
      scrollContainer: null, // optional scroll container selector, otherwise use window,
      resetAnimation: true, // reset animation on end (default is true)
    });
    wow.init();
  },
  methods: {
    getChecked(index) {
      this.list[index].checked = !this.list[index].checked
      this.$refs.echarts.drawEcharts()
    }
  },
}
</script>

<style lang="scss" scoped>
.list {
  margin-left: 20px;
  position: relative;
  width: calc(100% - 40px);
  margin-right: 20px;
  height: calc(50% - 20px);
  margin-bottom: 20px;
  //background: url("./assets/jiaobiaobg.png") no-repeat;
  //background-size: 100% 100%;
  display: flex;
  justify-content: flex-start;
  align-items: flex-start;
  flex-wrap: wrap;
  flex-direction: row;
  align-content: flex-start;

  .listItem {
    font-size: 14px;
    display: flex;
    height: 30%;
    margin-left: 10px;
    width: calc(50% - 20px);
    justify-content: space-between;
    align-items: center;
    flex-wrap: nowrap;
    flex-direction: row;
    align-content: flex-start;

    .listIteml {
      display: flex;
      justify-content: flex-start;
      align-items: center;
      flex-wrap: nowrap;
      flex-direction: row;
      align-content: flex-start;
      font-size: 14px;
      font-family: MicrosoftYaHei;
      font-weight: 400;
      color: #FFFFFF;
    }

    span {
      font-size: 14px;
      font-family: PingFang SC-Regular, PingFang SC;
      font-weight: 400;
      color: rgba(255, 255, 255, 1);
      line-height: 20px;
    }

    .dot {
      width: 8px;
      height: 8px;
      margin-right: 10px;
      flex-shrink: 0;
    }

    .dot.disabled {
      background: rgba(#999, 0.8) !important;
    }

    span.disabled {
      color: rgba(#999, 0.8) !important;
    }

    .num {
      font-size: 18px;
      font-family: DIN-Bold;
      font-weight: 500;
      color: #FFFFFF;
      text-shadow:0 0 10px #258af3;
      margin-right: 10px;
    }
  }
}

.echartsBodys {
  width: 100%;
  position: relative;
  height: 100%;
  display: flex;
  justify-content: space-between;
  align-items: center;
  flex-wrap: nowrap;
  flex-direction: column;
  align-content: flex-start;
}
</style>
echarts代码
<template>
  <div class="echartsBody">
    <div class="echartsBody1" ref="echarts1"></div>
    <div class="echartsBody2">
      <div class="echartsTitle">{{ total }}</div>
      <div class="echartsDesc">{{ title }}</div>
    </div>
  </div>
</template>

<script>
import * as echarts from "echarts"

export default {
  name: 'echarts1',
  components: {},
  data() {
    return {}
  },
  props: {
    list: {
      type: Array,
      default() {
        return [];
      }
    },
    shadowColor: {
      type: String,
      default() {
        return 'rgba(254, 175, 87, 0.5)';
      }
    },
    title: {
      type: String,
      default() {
        return '总数';
      }
    },
    total: {
      type: String,
      default() {
        return 0;
      }
    },
  },
  mounted() {
    var that = this;
    const viewElem = document.body;
    // 监听窗口变化,重绘echarts
    const resizeObserver = new ResizeObserver(() => {
      setTimeout(() => {
        that.drawEcharts();
      }, 300)
    });
    resizeObserver.observe(viewElem);
  },
  computed: {
    colorList: function () {
      var that = this;
      var colorList = []
      that.list.forEach((type) => {
        var color = new echarts.graphic.LinearGradient(0, 0, 1, 1, [{
          offset: 0,
          color: type.color1
        }, {
          offset: 1,
          color: type.color2
        }])
        colorList.push(color)
      });
      return colorList
    }
  },
  methods: {
    drawEcharts() {
      var that = this
      let myChart = echarts.init(this.$refs.echarts1)
      var colors = this.colorList
      var data = []
      that.list.forEach((type) => {
        if (type.checked) {
          var datas = {
            ...type,
            itemStyle: {
              normal: {
                borderColor: new echarts.graphic.LinearGradient(0, 0, 1, 1, [{
                  offset: 0,
                  color: type.color1
                }, {
                  offset: 1,
                  color: type.color2
                }]),
              }
            }
          }
          data.push(datas)
        }
      });
      var option = {
        color: colors,
        tooltip: {
          trigger: 'item',
          // formatter: '{a} {b} : {c} ({d}%)'
        },
        series: [
          {
            name: '资质管理',
            type: 'pie',
            roundCap: true,
            radius: ['75%', '90%'],
            center: ['50%', '50%'],
            borderCap: 'round',
            label: {
              show: false,
              normal: {
                show: false,
                fontSize: 14,
                color: '#92B2D7'
              }
            },
            labelLine: {
              show: false,
              length: 1,
              length2: 10
            },
            data: data
          },
          {
            type: 'pie',
            name: '饼状背景',
            radius: ['0%', '60%'],
            center: ['50%', '50%'],
            startAngle: 110,
            hoverAnimation: false,
            itemStyle: {
              normal: {
                color: new echarts.graphic.LinearGradient(0, 0, 1, 1, [{
                  offset: 0,
                  color: 'rgba(1, 26, 94, 1.00)'
                }, {
                  offset: 1,
                  color: 'rgba(1, 26, 94, 1.00)'
                }]),
              },
            },
            tooltip: {
              show: false,
            },
            label: {
              show: false
            },
            data: [50]
          },
        ]
      }
      myChart.clear()
      myChart.resize()
      myChart.setOption(option)
    },
  }
}
</script>

<style lang="scss" scoped>
.echartsBody {
  position: relative;
  width: 100%;
  height: calc(50% - 0px);

  .echartsBody1 {
    position: relative;
    width: 100%;
    height: calc(100% - 0px);
  }

  .echartsBody2 {
    position: absolute;
    top: 0;
    left: 0;
    width: 100%;
    height: calc(100% - 0px);
    display: flex;
    justify-content: center;
    align-items: center;
    flex-wrap: nowrap;
    flex-direction: column;
    align-content: flex-start;
    pointer-events: none;
    background: url("./assets/huanbg.png") center center no-repeat;
    background-size: 134px 134px;

    .echartsTitle {
      font-size: 30px;
      font-family: DIN-Bold;
      font-weight: bold;
      color: #FFFFFF;
      text-shadow: 0 0 10px rgba(120, 168, 238, 1.00);
    }

    .echartsDesc {
      font-size: 14px;
      font-family: MicrosoftYaHei;
      font-weight: 400;
      color: #9DB9E9;
    }
  }
}
</style>
百分比组件代码
<template>
  <span>{{ proportion }}%</span>
</template>

<script>
export default {
  name: "proportion",
  data() {
    return {}
  },
  computed: {
    proportion: function () {
      var total = 0
      this.list.forEach((type) => {
        total += type.value
      });
      return ((this.value / total) * 100).toFixed(2)
    }
  },
  components: {},
  props: {
    list: {
      type: Array,
      default() {
        return [];
      }
    },
    value: {
      type: Number,
      default() {
        return 0;
      }
    }
  },
  methods: {},
}
</script>


