数据大屏 项目开发中,需要使用echarts饼状图效果。
这里我们的饼状图要渐变色效果。
legend自定义程度不高,所以我们使用html方法实现。
指示小图标颜色也要渐变
显示数字是百分比形式展示。我们通过vue属性计算来实现。
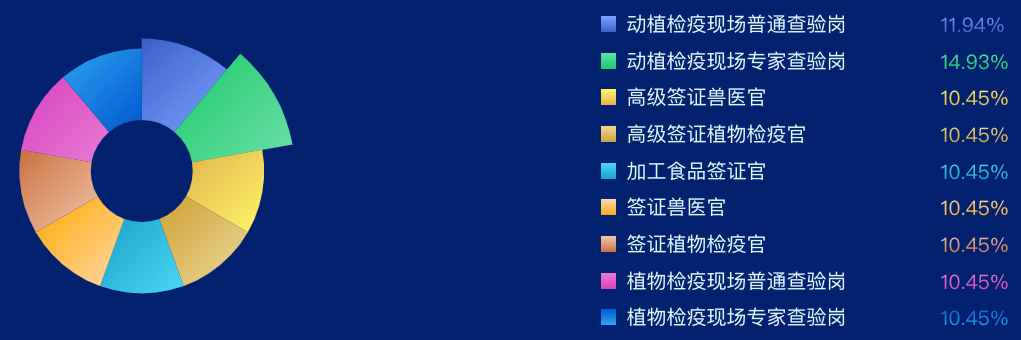
演示实例
右侧列表
列表要和legend一样可以置灰,并且以百分比形式展示。我们可以给列表添加一个选中字段,通过这个字段来判断当前数据是否显示。
<template>
  <div class="echartsBodys">
    <echarts1 title="人员资质" :total="total" :list="list" ref="echarts"></echarts1>
    <div class="list">
      <div class="listItem cur" @click="getChecked(index)" v-for="(item,index) in list" :key="index">
        <div class="listIteml">
          <div class="dot" :class="{disabled:!item.checked}"
               :style="'background: linear-gradient(0deg,'+item.color1+' 0%, '+item.color2+' 100%);'"></div>
          <span :class="{disabled:!item.checked}">{{ item.name }}</span>
        </div>
        <div class="num"
             v-if="item.checked"
             :style="'background: linear-gradient(0deg,'+item.color1+' 0%, '+item.color2+' 100%);-webkit-background-clip: text;-webkit-text-fill-color: transparent;'">
          <proportion :list="list" :value="item.value"></proportion>
        </div>
        <div class="num"
             v-else>
          <proportion :list="list" :value="item.value"></proportion>
        </div>
      </div>
    </div>
  </div>
</template>

<script>
import WOW from "wow.js";
import echarts1 from "./components/echarts.vue";
import proportion from "./proportion.vue";

export default {
  name: "title",
  data() {
    return {
      list: [
        {
          name: '动植检疫现场普通查验岗',
          value: 80,
          color1: 'rgba(55, 97, 202, 1)',
          color2: 'rgba(125, 162, 255, 1)',
          checked: true
        },
        {
          name: '动植检疫现场专家查验岗',
          value: 100,
          color1: 'rgba(26, 201, 104, 1)',
          color2: 'rgba(109, 224, 168, 1)',
          checked: true
        },
        {
          name: '高级签证兽医官',
          value: 70,
          color1: 'rgba(223, 180, 75, 1)',
          color2: 'rgba(255, 246, 103, 1)',
          checked: true
        },
        {
          name: '高级签证植物检疫官',
          value: 70,
          color1: 'rgba(206, 162, 55, 1)',
          color2: 'rgba(236, 217, 152, 1)',
          checked: true
        },
        {
          name: '加工食品签证官',
          value: 70,
          color1: 'rgba(26, 162, 201, 1)',
          color2: 'rgba(75, 215, 245, 1)',
          checked: true
        },
        {
          name: '签证兽医官',
          value: 70,
          color1: 'rgba(255, 168, 0, 1)',
          color2: 'rgba(255, 217, 168, 1)',
          checked: true
        },
        {
          name: '签证植物检疫官',
          value: 70,
          color1: 'rgba(201, 113, 65, 1)',
          color2: 'rgba(244, 198, 170, 1)',
          checked: true
        },
        {
          name: '植物检疫现场普通查验岗',
          value: 70,
          color1: 'rgba(216, 66, 193, 1)',
          color2: 'rgba(232, 123, 210, 1)',
          checked: true
        },
        {
          name: '植物检疫现场专家查验岗',
          value: 70,
          color1: 'rgba(43, 162, 238, 1)',
          color2: 'rgba(2, 88, 208, 1)',
          checked: true
        }]
    }
  },
  computed: {
    total: function () {
      var total = 0
      this.list.forEach((type) => {
        total += type.value
      });
      return total
    }
  },
  components: {echarts1, proportion},
  props: {
    title: {
      type: String,
      default() {
        return '';
      }
    },
    icon: {
      type: String,
      default() {
        return '';
      }
    },
  },
  watch: {},
  mounted() {
    var that = this;
    var wow = new WOW({
      boxClass: "wow", // animated element css class (default is wow)
      animateClass: "animated", // animation css class (default is animated)
      offset: 0, // distance to the element when triggering the animation (default is 0)
      mobile: true, // trigger animations on mobile devices (default is true)
      live: true, // act on asynchronously loaded content (default is true)
      callback: function (box) {
        // the callback is fired every time an animation is started
        // the argument that is passed in is the DOM node being animated
      },
      scrollContainer: null, // optional scroll container selector, otherwise use window,
      resetAnimation: true, // reset animation on end (default is true)
    });
    wow.init();
  },
  methods: {
    getChecked(index) {
      this.list[index].checked = !this.list[index].checked
      this.$refs.echarts.drawEcharts()
    }
  },
}
</script>

<style lang="scss" scoped>
.list {
  margin-left: 0px;
  position: relative;
  width: 50%;
  height: calc(100% - 10px);
  //background: url("./assets/jiaobiaobg.png") no-repeat;
  //background-size: 100% 100%;
  display: flex;
  justify-content: space-between;
  align-items: center;
  flex-wrap: nowrap;
  flex-direction: column;
  align-content: flex-start;

  .listItem {
    font-size: 14px;
    display: flex;
    height: 30%;
    width: calc(100% - 20px);
    margin: 0 auto;
    justify-content: flex-start;
    align-items: center;
    flex-wrap: nowrap;
    flex-direction: row;
    align-content: flex-start;

    .listIteml {
      display: flex;
      justify-content: flex-start;
      align-items: center;
      flex-wrap: nowrap;
      flex-direction: row;
      align-content: flex-start;
      font-size: 14px;
      font-family: MicrosoftYaHei;
      font-weight: 400;
      color: #FFFFFF;
      width: 340px;
    }

    span {
      font-size: 20px;
      font-family: PingFang SC-Regular, PingFang SC;
      font-weight: 400;
      color: #E0F9FF;
      line-height: 20px;
    }

    .dot {
      width: 16px;
      height: 16px;
      margin-right: 10px;
      flex-shrink: 0;
    }

    .dot.disabled {
      background: rgba(#999, 0.8) !important;
    }

    span.disabled {
      color: rgba(#999, 0.8) !important;
    }

    .num {
      font-size: 24px;
      font-family: DIN;
      font-weight: normal;
      color: #FFFFFF;
      line-height: 20px;
      background: linear-gradient(0deg, rgba(#999, 0.8) 0.1220703125%, rgba(#999, 0.8) 100%);
      -webkit-background-clip: text;
      -webkit-text-fill-color: transparent;
    }
  }
}

.echartsBodys {
  width: 100%;
  position: relative;
  height: 100%;
  display: flex;
  justify-content: space-between;
  align-items: center;
  flex-wrap: nowrap;
  flex-direction: row;
  align-content: flex-start;
}
</style>
左侧echarts
图表要颜色渐变,并且监听数据变化并重新绘制图表。
<template>
  <div class="echartsBody">
    <div class="echartsBody1" ref="echarts1"></div>
  </div>
</template>

<script>
import * as echarts from "echarts"

export default {
  name: 'echarts1',
  components: {},
  data() {
    return {}
  },
  props: {
    list: {
      type: Array,
      default() {
        return [];
      }
    },
    shadowColor: {
      type: String,
      default() {
        return 'rgba(254, 175, 87, 0.5)';
      }
    },
    title: {
      type: String,
      default() {
        return '人员资质';
      }
    },
    total: {
      type: String,
      default() {
        return 0;
      }
    },
  },
  mounted() {
    this.drawEcharts()
  },
  computed: {
    colorList: function () {
      var that = this;
      var colorList = []
      that.list.forEach((type) => {
            if (type.checked) {
              var color = new echarts.graphic.LinearGradient(0, 0, 1, 1, [{
                offset: 0,
                color: type.color1
              }, {
                offset: 1,
                color: type.color2
              }])
              colorList.push(color)
            }
          }
      );
      return colorList
    }
  },
  methods: {
    drawEcharts() {
      var that = this
      window.addEventListener('resize', this.drawEcharts)
      let myChart = echarts.init(this.$refs.echarts1)
      var colors = this.colorList
      var data = []
      var placeHolderStyle = {
        normal: {
          label: {
            show: false
          },
          labelLine: {
            show: false
          },
          color: 'rgba(0, 0, 0, 0)',
          borderColor: 'rgba(0, 0, 0, 0)',
          borderWidth: 0
        }
      };
      that.list.forEach((type) => {
        if (type.checked) {
          var datas = {
            ...type,
            itemStyle: {
              normal: {
                borderColor: new echarts.graphic.LinearGradient(0, 0, 1, 1, [{
                  offset: 0,
                  color: type.color1
                }, {
                  offset: 1,
                  color: type.color2
                }]),
                shadowColor: that.shadowColor
              }
            }
          }
          data.push(datas)
        }
      });
      var option = {
        color: colors,
        tooltip: {
          trigger: 'item',
          // formatter: '{a} {b} : {c} ({d}%)'
        },
        series: [
          {
            type: 'pie',
            roseType: 'area',
            center: ['40%', '50%'],
            radius: ['30%', '90%'],
            labelLine: {
              normal: {
                length: 20
              }
            },
            label: {
              show: false,
              position: 'inside',
              formatter: '{d}%',
              color: '#fff',
              fontSize: 16
            },
            itemStyle: {
              normal: {
                borderColor: '#3eebc4',
                borderWidth: 0
              }
            },
            data: data
          },
          // {
          //   type: 'pie',
          //   name: '饼状背景',
          //   radius: ['0%', '60%'],
          //   center: ['50%', '50%'],
          //   startAngle: 110,
          //   hoverAnimation: false,
          //   itemStyle: {
          //     normal: {
          //       color: new echarts.graphic.LinearGradient(0, 0, 1, 1, [{
          //         offset: 0,
          //         color: 'rgba(1, 26, 94, 1.00)'
          //       }, {
          //         offset: 1,
          //         color: 'rgba(1, 26, 94, 1.00)'
          //       }]),
          //       shadowBlur: 30,
          //       shadowColor: 'rgba(254, 175, 87, 0.3)'
          //     },
          //   },
          //   tooltip: {
          //     show: false,
          //   },
          //   label: {
          //     show: false
          //   },
          //   data: [50]
          // },
        ]
      }
      myChart.clear()
      myChart.resize()
      myChart.setOption(option)
    },
  }
}
</script>

<style lang="scss" scoped>
.echartsBody {
  position: relative;
  width: 50%;
  height: calc(100% - 0px);

  .echartsBody1 {
    position: relative;
    width: 100%;
    height: calc(100% - 0px);
  }

  .echartsBody2 {
    position: absolute;
    top: 0;
    left: 0;
    width: 100%;
    height: calc(100% - 0px);
    display: flex;
    justify-content: center;
    align-items: center;
    flex-wrap: nowrap;
    flex-direction: column;
    align-content: flex-start;
    pointer-events: none;

    .echartsTitle {
      font-size: 30px;
      font-family: DIN;
      font-weight: normal;
      color: #FFFFFF;
      text-shadow: 0 0 10px rgba(120, 168, 238, 1.00);
    }

    .echartsDesc {
      font-size: 14px;
      font-family: MicrosoftYaHei;
      font-weight: 400;
      color: #9DB9E9;
    }
  }
}
</style>
百分比计算组件
当前组件的作用就是通过列表数据计算当前数据占总数多少的组件。
<template>
  <span>{{ proportion }}%</span>
</template>

<script>
export default {
  name: "proportion",
  data() {
    return {}
  },
  computed: {
    proportion: function () {
      var total = 0
      this.list.forEach((type) => {
        total += type.value
      });
      return ((this.value / total) * 100).toFixed(2)
    }
  },
  components: {},
  props: {
    list: {
      type: Array,
      default() {
        return [];
      }
    },
    value: {
      type: Number,
      default() {
        return 0;
      }
    }
  },
  methods: {},
}
</script>


