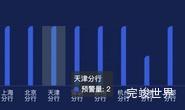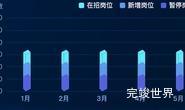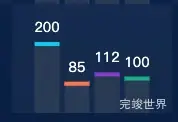
类似这样的效果
drawLine() {
      let myChart = this.$echarts.init(this.$refs.charts)
      var colors = ["rgba(79, 199, 234, 1)", "rgba(255, 126, 75, 1)", 'rgba(136, 43, 205, 1)', 'rgba(60, 175, 133, 1)'];
      // 绘制图表
      myChart.setOption({
        "textStyle": {
          "show": false,
          "color": "#c0c3cd",
          "fontSize": 14
        },
        "toolbox": {
          "show": false,
          "feature": {
            "saveAsImage": {
              "backgroundColor": "#031245"
            },
            "restore": {}
          },
          "iconStyle": {
            "borderColor": "#c0c3cd"
          }
        },
        "color": ["rgba(79, 199, 234, 1)", "rgba(255, 126, 75, 1)", 'rgba(136, 43, 205, 1)', 'rgba(60, 175, 133, 1)'],
        "grid": {
          "containLabel": true,
          "left": 20,
          "right": 20,
          "bottom": 0,
          "top": 40
        },
        "xAxis": {
          "nameTextStyle": {
            "color": "#c0c3cd",
            "padding": [0, 0, -10, 0],
            "fontSize": 14
          },
          "axisLabel": {
            "color": "#c0c3cd",
            "fontSize": 14,
            "interval": 0,
            show: false
          },
          "axisTick": {
            show: false,
            "lineStyle": {
              "color": "#384267",
              "width": 1
            },
          },
          "splitLine": {
            "show": false
          },

          "axisLine": {
            "lineStyle": {
              "color": "red",
            },
            show: false,
          },
          "data": ["北京", "大连", "上海", "深圳"],
          "type": "category"
        },
        "yAxis": {
          "nameTextStyle": {
            "color": "red",
            "padding": [0, 0, -10, 0],
            "fontSize": 14
          },
          "axisLabel": {
            show: false,
            "color": "red",
            "fontSize": 14
          },
          "axisTick": {
            "lineStyle": {
              "color": "red",
              "width": 1
            },
            "show": false
          },
          "splitLine": {
            "show": false,
            "lineStyle": {
              "color": "red",
              // "type": "dashed"
            }
          },
          "axisLine": {
            "lineStyle": {
              "color": "red",
              "width": 1,
              // "type": "dashed"
            },
            "show": false
          },
          "name": ""
        },
        "series": [
          {
            "data": [200, 85, 112, 100],
            "type": "bar",
            "barMaxWidth": "auto",
            "barWidth": 25,
            "itemStyle": {
              "color": {
                "x": 0,
                "y": 0,
                "x2": 0,
                "y2": 1,
                "type": "linear",
                "colorStops": [{
                  "offset": 0,
                  "color": "rgba(48, 58, 88, 0.9)"
                }, {
                  "offset": 1,
                  "color": "rgba(48, 58, 88, 0.9)"
                }]
              }
            },
            "label": {
              "show": true,
              "position": "top",
              "distance": 10,
              "color": "#fff"
            }
          }, {
            "data": [200, 85, 112, 100],
            "type": "pictorialBar",
            "barMaxWidth": "10",
            "symbolPosition": "end",
            "symbol": "Rectangle",
            "symbolOffset": [0, "-50%"],
            "symbolSize": [25, 4],
            "zlevel": 2,
            itemStyle: {
              normal: {
                borderWidth: 0,
                color: function (params) {
                  return colors[params.dataIndex];
                },
              }
            },
          }
        ],
        "tooltip": {
          "show": false,
          formatter: '数据:{c0}'
        }
      });
    }