drawLine() {
var that = this;
window.addEventListener("resize", this.drawLine);
let myChart = this.$echarts.init(this.$refs.echarts);
var option = {
color: [
"rgba(0, 204, 255, 1)",
"rgba(39, 120, 255, 1)",
"rgba(72, 176, 255, 1)",
"rgba(91, 207, 255, 1)",
"rgba(108, 227, 255, 1)",
"rgba(119, 240, 240, 1)",
"rgba(129, 163, 243, 1)",
"rgba(243, 170, 104, 1)",
"rgba(245, 232, 140, 1)",
"rgba(162, 143, 218, 1)",
"rgba(162, 238, 250, 1)",
"rgba(38, 116, 255, 1)",
"rgba(73, 177, 255, 1)",
],
grid: {
left: "5%",
right: "3%",
top: "12%",
bottom: "10%",
containLabel: true,
},
legend: {
x: 'center',
y: 'top',
itemWidth: 15,
itemHeight: 15,
textStyle: {
color: 'rgba(168, 230, 243, 1)'
},
itemGap: 20,
},
tooltip: {
show: true,
},
xAxis: [
{
data: [
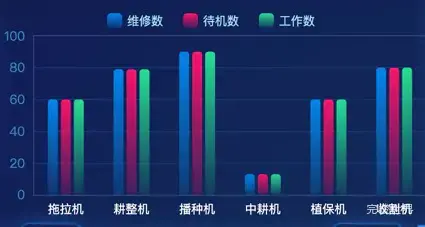
"拖拉机",
"耕整机",
"播种机",
"中耕机",
"植保机",
"收割机"
],
axisLine: {
lineStyle: {
color: "#354A80",
},
},
axisTick: {
show: false,
},
axisLabel: {
color: "#fff",
fontSize: 12,
},
},
{
data: [
"拖拉机",
"耕整机",
"播种机",
"中耕机",
"植保机",
"收割机"
],
axisLine: {
lineStyle: {
color: "#354A80",
},
},
axisTick: {
show: false,
},
axisLabel: {
show: false,
},
splitArea: {
show: false,
},
splitLine: {
show: false,
},
},
],
yAxis: [
{
axisLine: {
show: true,
lineStyle: {
color: "#354A80",
},
},
axisTick: {
show: false,
},
axisLabel: {
color: "#328BC7",
fontSize: 13,
},
splitLine: {
show: true,
lineStyle: {
color: "rgba(21, 58, 121, 1)",
},
},
yAxisIndex: 0,
},
],
series: [
{
name: "维修数",
type: "bar",
barWidth: 10,
zlevel: 2,
itemStyle: {
normal: {
barBorderRadius: 3,
color: new that.$echarts.graphic.LinearGradient(
0,
0,
0,
1,
[
{
offset: 0,
// color: "#0385E9",
color: "rgba(3, 133, 233, 1)",
},
{
offset: 1,
color: "rgba(3, 133, 233, 0.2)",
},
],
false
),
},
},
label: {
normal: {
show: false,
fontSize: 18,
fontWeight: "bold",
color: "#ffffff",
position: "top",
},
},
data: [60, 79, 90, 13, 60, 80, 80, 60, 79, 90, 13, 60, 80],
},
{
name: "待机数",
type: "bar",
barWidth: 10,
zlevel: 2,
yAxisIndex: 0,
itemStyle: {
normal: {
barBorderRadius: 3,
color: new that.$echarts.graphic.LinearGradient(
0,
0,
0,
1,
[
{
offset: 0,
color: "rgba(248, 18, 105, 1)",
},
{
offset: 1,
color: "rgba(248, 18, 105,0.2)",
},
],
false
),
},
},
label: {
normal: {
show: false,
fontSize: 18,
fontWeight: "bold",
color: "#ffffff",
position: "top",
},
},
data: [60, 79, 90, 13, 60, 80, 80, 60, 79, 90, 13, 60, 80],
},
{
name: "工作数",
type: "bar",
barWidth: 10,
zlevel: 2,
yAxisIndex: 0,
itemStyle: {
normal: {
barBorderRadius: 3,
color: new that.$echarts.graphic.LinearGradient(
0,
0,
0,
1,
[
{
offset: 0,
color: "rgba(39, 222, 146, 1)",
},
{
offset: 1,
color: "rgba(39, 222, 146, 0.1)",
},
],
false
),
},
},
label: {
normal: {
show: false,
fontSize: 18,
fontWeight: "bold",
color: "#ffffff",
position: "top",
},
},
data: [60, 79, 90, 13, 60, 80, 80, 60, 79, 90, 13, 60, 80],
},
],
};
myChart.clear();
myChart.resize();
myChart.setOption(option);
},