echarts网格线虚线

echarts yekong 2087℃

echarts网格线虚线

splitLine: {
              show: true,
              lineStyle: {
                color: 'rgba(43, 68, 124, 1)',
                width: 1,
                type: 'dashed'
              },
            },
window.addEventListener('resize', this.drawLine)
      let myChart = this.$echarts.init(this.$refs.echarts)
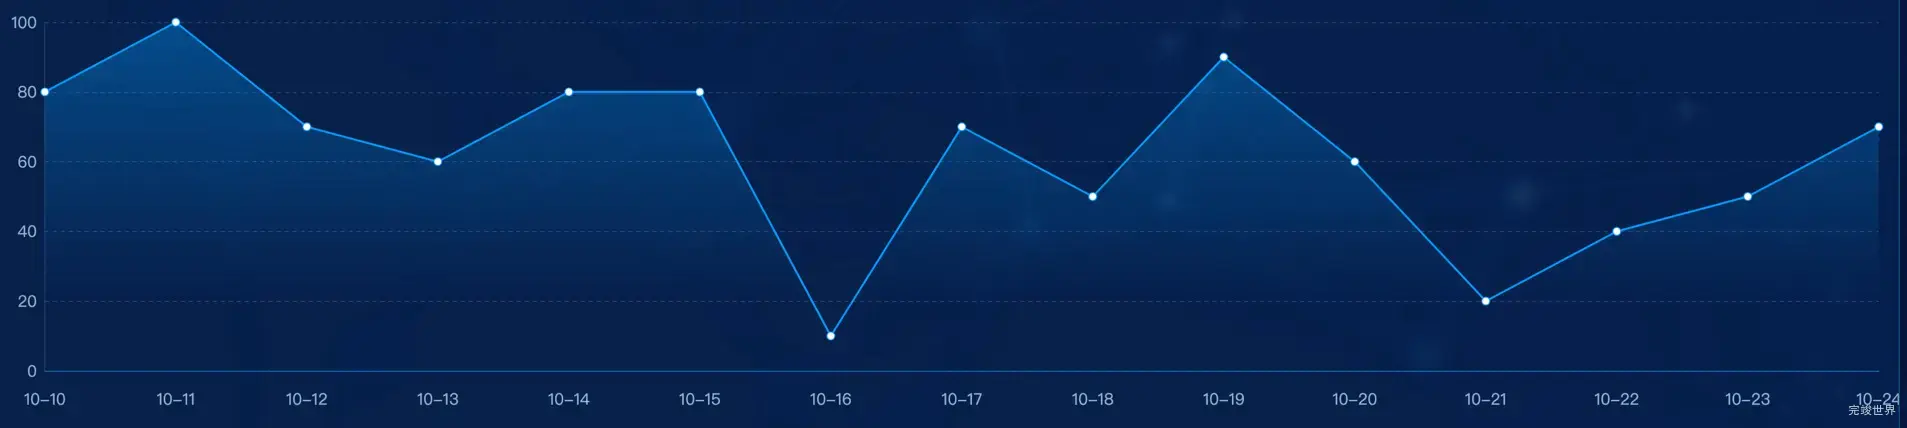
      let label = ['10-10', '10-11', '10-12', '10-13', '10-14', '10-15', '10-16', '10-17', '10-18', '10-19', '10-20', '10-21', '10-22', '10-23', '10-24']
      let value = [80, 100, 70, 60, 80, 80, 10, 70, 50, 90, 60, 20, 40, 50, 70, 60, 40, 50, 20, 70, 50, 30,]
      var option = {
        grid: {
          top: 50,
          left: 20,
          right: 20,
          bottom: 100,
          containLabel: true,
        },
        tooltip: {
          trigger: 'axis',
          axisPointer: {
            lineStyle: {
              color: {
                type: 'linear',
                x: 0,
                y: 0,
                x2: 0,
                y2: 1,
                colorStops: [
                  {
                    offset: 0,
                    color: 'rgba(255,255,255,0)', // 0% 处的颜色
                  },
                  {
                    offset: 0.5,
                    color: 'rgba(255,255,255,1)', // 100% 处的颜色
                  },
                  {
                    offset: 1,
                    color: 'rgba(255,255,255,0)', // 100% 处的颜色
                  },
                ],
                global: false, // 缺省为 false
              },
            },
          },
        },
        xAxis: [
          {
            type: 'category',
            boundaryGap: false,
            axisLabel: {
              formatter: '{value}',
              fontSize: 16,
              margin: 20,
              textStyle: {
                color: 'rgba(143, 178, 204, 1)',
              },
            },
            axisLine: {
              lineStyle: {
                color: 'rgba(0, 156, 255, 0.56)',
              },
              
            },
            splitLine: {
              show: false,
              lineStyle: {
                color: '#243753',

              },
            },
            axisTick: {
              show: false,
            },
            data: label,
          },
        ],
        yAxis: [
          {
            boundaryGap: false,
            type: 'value',
            axisLabel: {
              textStyle: {
                color: 'rgba(143, 178, 204, 1)',
                fontSize: 16,
                margin: 20,
              },
            },
            splitLine: {
              show: true,
              lineStyle: {
                color: 'rgba(43, 68, 124, 1)',
                width: 1,
                type: 'dashed'
              },
            },
            axisLine: {
              show: true,
              lineStyle: {
                color: 'rgba(58, 84, 143, 0.56)',
              },
            },
            axisTick: {
              show: false,
            },
          },
        ],
        series: [
          {
            name: '历史问题',
            type: 'line',
            smooth: false,
            showSymbol: true,
            symbolSize: 8,
            zlevel: 3,
            itemStyle: {
              color: 'rgba(0, 156, 255, 1)',
              borderColor: 'rgba(0, 156, 255, 1)',
            },
            lineStyle: {
              normal: {
                width: 2,
                color: 'rgba(0, 156, 255, 1)',
              },
            },
            areaStyle: {
              normal: {
                color: new this.$echarts.graphic.LinearGradient(
                  0,
                  0,
                  0,
                  1,
                  [
                    {
                      offset: 0,
                      color: 'rgba(0, 156, 255, 0.5)',
                    },
                    {
                      offset: 0.8,
                      color: 'rgba(0, 156, 255, 0)',
                    },
                  ],
                  false
                ),
              },
            },
            data: value,
          },
        ],
      }

      myChart.clear()
      myChart.resize()
      myChart.setOption(option)
    },
喜欢 (3)