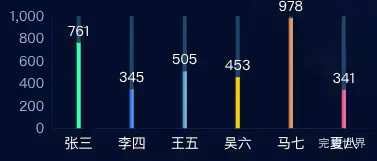
echarts 宽度只有4的柱状图,带背景图,柱状图为不同颜色的渐变色柱状图。
效果截图
组件代码
<template>
  <div class="echarts1" ref="echarts">

  </div>
</template>

<script>
import * as echarts from "echarts"

export default {
  name: 'echarts1',
  components: {},
  data() {
    return {
      colorList: [
        'rgba(1, 255, 150, 1.00)',
        'rgba(11, 102, 222, 1.00)',
        'rgba(59, 131, 194, 1.00)',
        'rgba(255, 189, 0, 1.00)',
        'rgba(190, 98, 47, 1.00)',
        'rgba(224, 51, 110, 1.00)',
      ],
      colorList2: [
        'rgba(73, 255, 178, 1.00)',
        'rgba(112, 165, 240, 1.00)',
        'rgba(154, 205, 238, 1.00)',
        'rgba(248, 226, 4, 1.00)',
        'rgba(240, 191, 134, 1.00)',
        'rgba(248, 141, 177, 1.00)',
      ],
    }
  },
  props: {
    list: {
      type: Array,
      default() {
        return [];
      }
    },
    name: {
      type: String,
      default() {
        return '';
      }
    },
  },
  mounted() {
    var that = this;
    const viewElem = document.body;
    // 监听窗口变化,重绘echarts
    const resizeObserver = new ResizeObserver(() => {
      setTimeout(() => {
        that.drawEcharts();
      }, 300)
    });
    resizeObserver.observe(viewElem);
  },
  methods: {
    drawEcharts() {
      var that = this
      let myChart = echarts.init(this.$refs.echarts)
      var option = {
        grid: {
          left: '5%',
          right: '3%',
          top: '10%',
          bottom: '10%',
          containLabel: true
        },
        tooltip: {
          show: true,
        },
        xAxis: {
          data: this.list.map(obj => obj.name),
          axisLine: {
            lineStyle: {
              color: 'rgba(6, 32, 76, 1.00)'
            }
          },
          axisTick: {
            show: false
          },
          axisLabel: {
            color: 'rgba(255,255,255, 1)',
            fontSize: 14,
          }
        },
        yAxis: [
          {
            axisLine: {
              show: true,
              lineStyle: {
                color: 'rgba(6, 32, 77, 1.00)'
              }
            },
            axisTick: {
              show: false
            },
            min: 0,
            axisLabel: {
              color: 'rgba(150, 175, 220, 1)',
              fontSize: 14,
              formatter: '{value}',
            },
            splitLine: {
              show: false,
              lineStyle: {
                color: '#2d3d53'
              }
            },
            yAxisIndex: 0
          }],
        series: [
          {
            name: this.name,
            type: 'bar',
            barWidth: 4,
            zlevel: 2,
            showBackground: true,
            backgroundStyle: {
              color: '#1f456a',
              borderRadius: 5,
            },
            label: {
              show: true, // 启用标签
              position: 'top', // 标签位置设为柱子顶部
              color: '#fff', // 设置文字颜色
              fontSize: 14, // 设置文字大小
              formatter: '{c}', // 通过格式化器展示具体数值
            },
            itemStyle: {
              normal: {
                color: function (params) {
                  return new echarts.graphic.LinearGradient(0, 0, 1, 0, [{
                    offset: 0,
                    color: that.colorList[params.dataIndex]
                  }, {
                    offset: 1,
                    color: that.colorList2[params.dataIndex]
                  }], false)
                }
              }
            },
            data: this.list.map(obj => obj.value)
          },
        ]
      }
      myChart.clear()
      myChart.resize()
      myChart.setOption(option)
    },
  }
}
</script>

<style lang="scss" scoped>
.echarts1 {
  position: relative;
  width: 100%;
  height: 100%;
}
</style>