echarts除了可以使用字体图标作为自定义图标外:
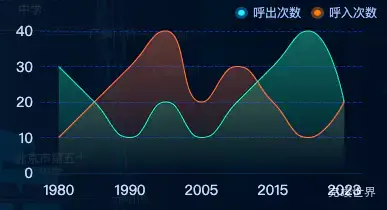
echarts legend图标设置为圆角矩形或自定义图标,我们还可以使用自定义图片来实现legend的图标。
关键代码
使用自定义图标的方式因为每个数据的颜色不同,为了区分,我们需要给每组数据都指定一个图片图标。
legend: {
  top: 10,
  left: 'right',
  itemWidth: 13,
  itemHeight: 13,
  textStyle: {
    color: 'rgba(157, 185, 233, 1)',
    fontSize: '12'
  },
  data: [{
    name: '呼出次数',
    icon: 'image://' + icon1 // 使用 icon1 图片作为图标
  },
    {
      name: '呼入次数',
      icon: 'image://' + icon2 // 使用 icon2 图片作为图标
    }]
},
完整实例
<script>
import * as echarts from "echarts"
import icon1 from './assets/icon_dot1.png'
import icon2 from './assets/icon_dot2.png'
export default {
  name: 'echarts1',
  components: {},
  props: {
    id: {
      type: String,
      default() {
        return ''
      }
    }
  },
  data() {
    return {
      xData: ['1980', '1985', '1990', '2000', '2005', '2010', '2015', '2020', '2023'],
      yData: [10, 20, 30, 40, 20, 30, 20, 10, 20],
      yData2: [30, 20, 10, 20, 10, 20, 30, 40, 20],
    }
  },
  watch: {},
  mounted() {
    var that = this;
    const viewElem = document.body;
    // 监听窗口变化,重绘echarts
    const resizeObserver = new ResizeObserver(() => {
      setTimeout(() => {
        that.drawEcharts();
      }, 300)
    });
    resizeObserver.observe(viewElem);
  },
  methods: {
    drawEcharts() {
      var that = this;
      // 基于准备好的dom,初始化echarts实例
      let myChart = echarts.init(this.$refs.echarts)
      var option = {
        legend: {
          top: 10,
          left: 'right',
          itemWidth: 13,
          itemHeight: 13,
          textStyle: {
            color: 'rgba(157, 185, 233, 1)',
            fontSize: '12'
          },
          data: [{
            name: '呼出次数',
            icon: 'image://' + icon1 // 使用 icon1 图片作为图标
          },
            {
              name: '呼入次数',
              icon: 'image://' + icon2 // 使用 icon2 图片作为图标
            }]
        },
        grid: {
          top: '40px',
          bottom: '0px',
          left: '20px',
          right: '20px',
          containLabel: true
        },
        tooltip: {
          trigger: 'axis',
          axisPointer: {
            type: 'shadow',
            shadowStyle: {
              color: new echarts.graphic.LinearGradient(0, 0, 0, 1, [{
                offset: 0,
                color: 'rgba(220, 239, 238, 0.1)'
              }, {
                offset: 1,
                color: 'rgba(220, 239, 238, 0.5)'
              }], false),
            }
          }
        },
        xAxis: [
          {
            data: this.xData,
            axisLabel: {
              margin: 10,
              color: 'rgba(202, 215, 245, 1)',
              textStyle: {
                fontSize: 14,
                fontFamily: 'DIN-Bold'
              },
            },
            axisLine: {
              lineStyle: {
                color: '#0a2544',
                width: 1
              }
            },
            splitLine: {
              show: false,
              lineStyle: {
                color: 'rgba(39, 76, 129, 0.26)',
                width: 1,
              }
            },
            axisTick: {
              show: false
            },
          }],
        yAxis: [
          {
            axisLabel: {
              color: 'rgba(202, 215, 245, 1)',
              textStyle: {
                fontSize: 14,
                fontFamily: 'DIN-Bold'
              },
            },
            axisLine: {
              lineStyle: {
                color: '#0a2544',
              }
            },
            axisTick: {
              show: false
            },
            splitLine: {
              show: true,
              lineStyle: {
                color: '#072a7b',
                width: 1,
                type: 'dashed'
              }
            }
          }],
        series: [
          {
            name: '呼出次数',
            type: 'line',
            data: that.yData,
            smooth: true,
            symbol: 'circle', //数值点设定为实心点
            symbolSize: 0, // 折线的点的大小
            itemStyle: {
              normal: {
                color: 'rgba(243, 119, 79, 1.00)', //点的颜色
                lineStyle: {
                  color: 'rgba(243, 119, 79, 1.00)', //线的颜色
                  width: 1, // 折线图线条粗细设置
                },
              },
            },
            areaStyle: {
              normal: {
                color: new echarts.graphic.LinearGradient(0, 0, 0, 1, [{
                  offset: 0,
                  color: 'rgba(243, 119, 79, 0.5)'
                },
                  {
                    offset: 1,
                    color: 'rgba(243, 119, 79, 0)'
                  }
                ], false),
              }
            },
          },
          {
            name: '呼入次数',
            type: 'line',
            data: that.yData2,
            smooth: true,
            symbol: 'circle', //数值点设定为实心点
            symbolSize: 0, // 折线的点的大小
            itemStyle: {
              normal: {
                color: 'rgba(32, 235, 191, 1.00)', //点的颜色
                lineStyle: {
                  color: 'rgba(32, 235, 191, 1.00)', //线的颜色
                  width: 1, // 折线图线条粗细设置
                },
              },
            },
            areaStyle: {
              normal: {
                color: new echarts.graphic.LinearGradient(0, 0, 0, 1, [{
                  offset: 0,
                  color: 'rgba(32, 235, 191, 0.5)'
                },
                  {
                    offset: 1,
                    color: 'rgba(32, 235, 191, 0)'
                  }
                ], false),
              }
            },
          },
        ]
      }
      myChart.clear()
      myChart.resize()
      myChart.setOption(option)
    },
  }
}
</script>