drawLine() {
var that = this;
window.addEventListener("resize", this.drawLine);
let myChart = this.$echarts.init(this.$refs.echarts);
var option = {
color: [
"rgba(0, 204, 255, 1)",
"rgba(39, 120, 255, 1)",
"rgba(72, 176, 255, 1)",
"rgba(91, 207, 255, 1)",
"rgba(108, 227, 255, 1)",
"rgba(119, 240, 240, 1)",
"rgba(129, 163, 243, 1)",
"rgba(243, 170, 104, 1)",
"rgba(245, 232, 140, 1)",
"rgba(162, 143, 218, 1)",
"rgba(162, 238, 250, 1)",
"rgba(38, 116, 255, 1)",
"rgba(73, 177, 255, 1)",
],
grid: {
left: "5%",
right: "3%",
top: "22%",
bottom: "10%",
containLabel: true,
},
tooltip: {
show: true,
},
xAxis: [
{
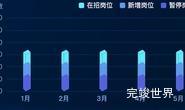
data: [
"1月",
"2月",
"3月",
"4月",
"5月",
"6月",
"7月",
"8月",
"9月",
"10月",
"11月",
"12月",
],
axisLine: {
lineStyle: {
color: "#3d5269",
},
},
axisTick: {
show: false,
},
axisLabel: {
color: "rgba(150, 175, 220, 1)",
fontSize: 12,
},
},
{
data: [
"1月",
"2月",
"3月",
"4月",
"5月",
"6月",
"7月",
"8月",
"9月",
"10月",
"11月",
"12月",
],
axisLine: {
lineStyle: {
color: "#3d5269",
},
},
axisTick: {
show: false,
},
axisLabel: {
show: false,
},
splitArea: {
show: false,
},
splitLine: {
show: false,
},
},
],
yAxis: [
{
name: "进入",
nameTextStyle: {
color: "rgba(150, 175, 220, 1)",
fontSize: 13,
},
axisLine: {
show: true,
lineStyle: {
color: "rgba(32, 72, 141, 1)",
},
},
axisTick: {
show: false,
},
axisLabel: {
color: "rgba(150, 175, 220, 1)",
fontSize: 13,
},
splitLine: {
show: true,
lineStyle: {
color: "rgba(21, 58, 121, 1)",
},
},
yAxisIndex: 0,
},
{
name: "离开",
nameTextStyle: {
color: "rgba(150, 175, 220, 1)",
fontSize: 13,
left: 0,
},
axisLine: {
show: true,
lineStyle: {
color: "rgba(32, 72, 141, 1)",
},
},
axisTick: {
show: false,
},
axisLabel: {
color: "rgba(150, 175, 220, 1)",
fontSize: 13,
},
splitLine: {
show: true,
lineStyle: {
color: "rgba(21, 58, 121, 1)",
},
},
yAxisIndex: 1,
},
],
series: [
{
name: "进入",
type: "bar",
barWidth: 10,
zlevel: 2,
itemStyle: {
normal: {
color: new that.$echarts.graphic.LinearGradient(
0,
0,
0,
1,
[
{
offset: 0,
color: "rgba(0, 204, 255, 1)",
},
{
offset: 1,
color: "rgba(11, 46, 116, 1)",
},
],
false
),
},
},
label: {
normal: {
show: false,
fontSize: 18,
fontWeight: "bold",
color: "#ffffff",
position: "top",
},
},
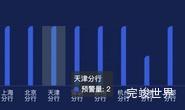
data: [60, 79, 90, 13, 60, 80, 80, 60, 79, 90, 13, 60, 80],
},
{
name: "离开",
type: "bar",
barWidth: 10,
zlevel: 2,
yAxisIndex: 1,
itemStyle: {
normal: {
color: new that.$echarts.graphic.LinearGradient(
0,
0,
0,
1,
[
{
offset: 0,
color: "rgba(20, 83, 199, 1)",
},
{
offset: 1,
color: "rgba(0, 16, 96, 1)",
},
],
false
),
},
},
label: {
normal: {
show: false,
fontSize: 18,
fontWeight: "bold",
color: "#ffffff",
position: "top",
},
},
data: [60, 79, 90, 13, 60, 80, 80, 60, 79, 90, 13, 60, 80],
},
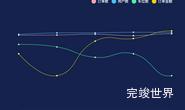
{
name: "来访人员统计",
type: "line",
smooth: true, //是否平滑
showAllSymbol: true,
symbol: "circle",
yAxisIndex: 0,
symbolSize: 8,
lineStyle: {
normal: {
color: "#31CCBC",
},
},
zlevel: 3,
label: {
show: false,
position: "top",
textStyle: {
color: "rgba(255, 222, 0, 1)",
},
},
itemStyle: {
color: "rgba(255, 222, 0, 1)",
borderColor: "#fff",
borderWidth: 1,
},
data: [60, 79, 90, 13, 60, 80, 80, 60, 79, 90, 13, 60, 80],
},
],
};
myChart.clear();
myChart.resize();
myChart.setOption(option);
},