第一种方法更换依赖
直接使用修改后的源,无需修改源码
第二种方法修改依赖
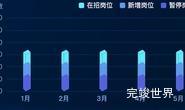
直接修改依赖,但是每次都需要修改依赖Echarts实现柱状图发光警报 发光涟漪
安装修改后的Echarts
npm install https://gitee.com/yelingkong/echarts-faguang.git --save
main引用
import echarts from 'echarts'
Vue.prototype.$echarts = echarts
使用
<template>
  <div class="echarts1" ref="echarts">

  </div>
</template>

<script>

export default {
  name: 'echarts1',
  components: {},
  props: {
    id: {
      type: String,
      default () {
        return ''
      }
    }
  },
  data () {
    return {
      status: ''
    }
  },
  watch: {},
  mounted () {
    this.drawLine()
  },
  methods: {
    drawLine () {
      window.addEventListener('resize', this.drawLine)
      let myChart = this.$echarts.init(this.$refs.echarts)
      let data = this.getdata()
      var option = {
        color: ['rgba(0, 204, 255, 1)',
          'rgba(39, 120, 255, 1)',
          'rgba(72, 176, 255, 1)',
          'rgba(91, 207, 255, 1)',
          'rgba(108, 227, 255, 1)',
          'rgba(119, 240, 240, 1)',
          'rgba(129, 163, 243, 1)',
          'rgba(243, 170, 104, 1)',
          'rgba(245, 232, 140, 1)',
          'rgba(162, 143, 218, 1)',
          'rgba(162, 238, 250, 1)',
          'rgba(38, 116, 255, 1)',
          'rgba(73, 177, 255, 1)',
        ],
        grid: {
          left: '5%',
          right: '3%',
          top: '15%',
          bottom: '10%',
          containLabel: true
        },
        tooltip: {
          show: true,
        },
        xAxis: {
          data: ['其他1', '其他2', '其他3', '其他4', '其他5', '其他6', '其他7', '其他8', '其他9', '其他10', '其他11', '其他12', '其他13'],
          axisLine: {
            lineStyle: {
              color: '#3d5269'
            }
          },
          axisTick: {
            show: false
          },
          axisLabel: {
            color: 'rgba(150, 175, 220, 1)',
            fontSize: 12,
            interval: 0,
            rotate: 50
          }
        },
        yAxis: [{
          nameTextStyle: {
            color: 'rgba(150, 175, 220, 1)',
            fontSize: 13
          },
          axisLine: {
            show: false,
            lineStyle: {
              color: '#3d5269'
            }
          },
          axisTick: {
            show: false
          },
          axisLabel: {
            color: 'rgba(150, 175, 220, 1)',
            fontSize: 13
          },
          splitLine: {
            show: true,
            lineStyle: {
              color: '#2d3d53'
            }
          },
          yAxisIndex: 0
        }],
        series: [
          {
            name: '健康',
            type: 'bar',
            barWidth: 10,
            zlevel: 2,
            data: data,
            label: {
              normal: {
                show: false,
                fontSize: 18,
                fontWeight: 'bold',
                color: '#ffffff',
                position: 'top',
              }
            },
          }]
      }
      myChart.clear()
      myChart.resize()
      myChart.setOption(option)
    },
    getdata () {
      var max = 200
      var data = [200, 102, 165, 245, 475, 201, 121, 325, 165, 245, 375, 201, 201]
      var data2 = []
      var itemStyle2 = {
        color: new this.$echarts.graphic.LinearGradient(1, 0, 1, 1, [
          {
            offset: 0,
            color: 'rgba(0, 204, 255, 1)'
          },
          {
            offset: 1,
            color: 'rgba(11, 46, 116, 1)'
          }
        ]),
      }
      var itemStyle1 = {
        color: new this.$echarts.graphic.LinearGradient(0, 0, 1, 1, [
          {
            offset: 0,
            color: 'rgba(221,107,102,0.7)'
          },
          {
            offset: 0.8,
            color: 'rgb(238,64,61)'
          },
          {
            offset: 1,
            color: 'rgb(186,39,38)'
          }
        ]),
        borderColor: new this.$echarts.graphic.LinearGradient(
          0,
          0,
          1,
          1,
          [
            {
              offset: 0,
              color: 'rgba(221,107,102,0.7)'
            },
            {
              offset: 0.8,
              color: 'rgb(238,64,61)'
            },
            {
              offset: 1,
              color: 'rgb(186,39,38)'
            }
          ]
        ),
        borderWidth: 3,
        lineWidth: 2,
        twinkle: {
          enabled: true,
          period: 2000
        }
      }
      for (var i = 0; i < data.length; i++) {
        let data_one = {
          value: 0,
          itemStyle: {}
        }
        data_one.value = data[i]
        if (data[i] > max) {
          data_one.itemStyle = itemStyle1
        } else {
          data_one.itemStyle = itemStyle2
        }
        data2.push(data_one)
      }
      return data2
    }
  }
}
</script>

<style lang="scss" scoped>
.echarts1 {
  position: relative;
  width: 100%;
  height: 100%;
}
</style>