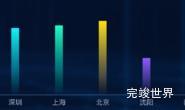
echarts 菱形柱状图效果

实现代码
<template>
  <div class="echarts1" ref="echarts">

  </div>
</template>

<script>

export default {
  name: 'echarts',
  components: {},
  props: {
    title: {
      type: String,
      default() {
        return ''
      }
    },
  },
  data() {
    return {
      active: false,
      data: [
        {
          "name": "醋酒-包装线1",
          "finishNum": "15",
          "unstartNum": "10",
          "num": "25"
        },
        {
          "name": "醋酒-包装线2",
          "finishNum": "8",
          "unstartNum": "11",
          "num": "19"
        },
        {
          "name": "醋酒-包装线3",
          "finishNum": "6",
          "unstartNum": "14",
          "num": "20"
        },
        {
          "sysOrgCode": "A03",
          "name": "醋酒-包装线4",
          "finishNum": "16",
          "unstartNum": "5",
          "num": "21"
        },
        {
          "name": "醋酒-包装线5",
          "finishNum": "14",
          "unstartNum": "8",
          "num": "22"
        },
        {
          "name": "醋酒-包装线6",
          "finishNum": "3",
          "unstartNum": "15",
          "num": "18"
        },
        {
          "name": "醋酒-包装线7",
          "finishNum": "19",
          "unstartNum": "3",
          "num": "22"
        },
        {
          "name": "蚝油-包装线1",
          "finishNum": "11",
          "unstartNum": "1",
          "num": "12"
        },
        {
          "name": "蚝油-包装线2",
          "finishNum": "19",
          "unstartNum": "10",
          "num": "29"
        },
        {
          "name": "蚝油-包装线3",
          "finishNum": "7",
          "unstartNum": "11",
          "num": "18"
        },
        {
          "name": "蚝油-包装线4",
          "finishNum": "15",
          "unstartNum": "17",
          "num": "32"
        },
        {
          "name": "蚝油-包装线5",
          "finishNum": "13",
          "unstartNum": "15",
          "num": "28"
        }
      ]
    }
  },
  computed: {
    xData: function () {
      var list = []
      this.data.forEach((type) => {
        if (type.name.includes(this.title)) {
          list.push(type.name)
        }
      });
      return list
    },
    yData1: function () {
      var list = []
      this.data.forEach((type) => {
        if (type.name.includes(this.title)) {
          list.push(Number(type.finishNum))
        }
      });
      return list
    },
    yData2: function () {
      var list = []
      this.data.forEach((type) => {
        if (type.name.includes(this.title)) {
          list.push(Number(type.num))
        }
      });
      return list
    },
    yData3: function () {
      var list = []
      this.data.forEach((type) => {
        if (type.name.includes(this.title)) {
          list.push(Number(type.unstartNum))
        }
      });
      return list
    },
  },
  watch: {},
  mounted() {
    this.drawLine()
  },
  methods: {
    drawLine() {
      // 基于准备好的dom,初始化echarts实例
      window.addEventListener('resize', this.drawLine)
      let myChart = this.$echarts.init(this.$refs.echarts)
// mock 数据
      const dataArr = {
        xdata: this.xData,
        result: [
          {name: '已完成', data: this.yData1},
          {name: '已开始', data: this.yData2},
          {name: '未开始', data: this.yData3}
        ]
      }
      const diamondData = dataArr.result.reduce((pre, cur, index) => {
        pre[index] = cur.data.map((el, id) => el + (pre[index - 1] ? pre[index - 1][id] : 0))
        return pre
      }, [])

      const color = [
        [{offset: 0, color: "rgba(58, 227, 253, 1.00)",},
          {offset: 0.5, color: "rgba(58, 227, 253, 1.00)",},
          {offset: 0.5, color: "rgba(58, 227, 253, 1.00)",},
          {
            offset: 1,
            color: "rgba(58, 227, 253, 1.00)",
          }],
        [{offset: 0, color: "rgba(93, 218, 108, 1.00)",},
          {offset: 0.5, color: "rgba(93, 218, 108, 1.00)",},
          {offset: 0.5, color: "rgba(93, 218, 108, 1.00)",},
          {
            offset: 1,
            color: "rgba(93, 218, 108, 1.00)",
          }],
        [{offset: 0, color: "rgba(253, 191, 58, 1.00)",},
          {offset: 0.5, color: "rgba(253, 191, 58, 1.00)",},
          {offset: 0.5, color: "rgba(253, 191, 58, 1.00)",},
          {
            offset: 1,
            color: "rgba(253, 191, 58, 1.00)",
          }],
        [{offset: 0, color: "#32ffee",}, {offset: 0.5, color: "#32ffee",}, {offset: 0.5, color: "#00e8d5",}, {
          offset: 1,
          color: "#00e8d5",
        }],
        [{offset: 0, color: "#46c9ff",}, {offset: 0.5, color: "#46c9ff",}, {offset: 0.5, color: "#00b4ff",}, {
          offset: 1,
          color: "#00b4ff",
        }],
        [{offset: 0, color: "#54a0ff",}, {offset: 0.5, color: "#54a0ff",}, {offset: 0.5, color: "#1f83ff",}, {
          offset: 1,
          color: "#1f83ff",
        }],
      ]
      let series = dataArr.result.reduce((p, c, i, array) => {
        p.push({
          z: i + 1,
          stack: '总量',
          type: 'bar',
          name: c.name,
          barGap: '-100%',
          barWidth: 25,
          data: c.data,
          itemStyle: {color: {type: 'linear', x: 0, x2: 1, y: 0, y2: 0, colorStops: color[i]}},
        }, {
          z: i + 10,
          type: 'pictorialBar',
          symbolPosition: 'end',
          symbol: 'diamond',
          symbolOffset: [0, '-50%'],
          symbolSize: [25, 10],
          data: diamondData[i],
          itemStyle: {color: {type: 'linear', x: 0, x2: 1, y: 0, y2: 0, colorStops: color[i]}},
          tooltip: {show: false},
        })

        // 是否最后一个了?
        if (p.length === (array.length) * 2) {
          p.push({
            z: array.length * 2,
            type: "pictorialBar",
            symbolPosition: "start",
            data: dataArr.result[0].data,
            symbol: "diamond",
            symbolOffset: ["0%", "50%"],
            symbolSize: [25, 10],
            itemStyle: {color: {type: 'linear', x: 0, x2: 1, y: 0, y2: 0, colorStops: color[0]}},
            tooltip: {show: false},
          })
          return p
        }

        return p
      }, [])

      const tooltip = {trigger: "axis"}

      const legend = {
        data: dataArr.result.map(item => item.name),
        textStyle: {fontSize: 14, color: 'rgba(173, 209, 244, 1.00)'},
        itemWidth: 15,
        itemHeight: 15,
        itemGap: 15,
        right: 0,
        top: '2%',
      }
      const grid = {top: '10%', left: '10%', right: '3%', bottom: '15%'}
      const xAxis = {
        axisTick: {show: false},
        axisLine: {lineStyle: {color: 'rgba(72, 81, 83, 1.00)'}},
        axisLabel: {textStyle: {fontSize: 16, color: '#B5DBFF'},},
        data: dataArr.xdata
      }

      const yAxis = [{
        name: '订单数量',
        nameTextStyle: {
          color: 'rgba(183, 187, 187, 1.00)',
          fontSize: 14,
          padding: [0, 0, 0, -10]
        },
        axisTick: {show: false},
        splitLine: {lineStyle: {color: 'rgba(255,255,255, .05)'}},
        axisLine: {lineStyle: {color: 'rgba(72, 81, 83, 1.00)'}},
        axisLabel: {textStyle: {fontSize: 16, color: '#B5DBFF'}}
      }]

      var option = {
        tooltip, xAxis, yAxis, series, grid, legend,
      }
      myChart.clear()
      myChart.resize()
      myChart.setOption(option)
    },
  }
}
</script>

<style lang="scss" scoped>
.echarts1 {
  position: relative;
  width: 100%;
  height: calc(100% - 0PX);
}
</style>