ID
2
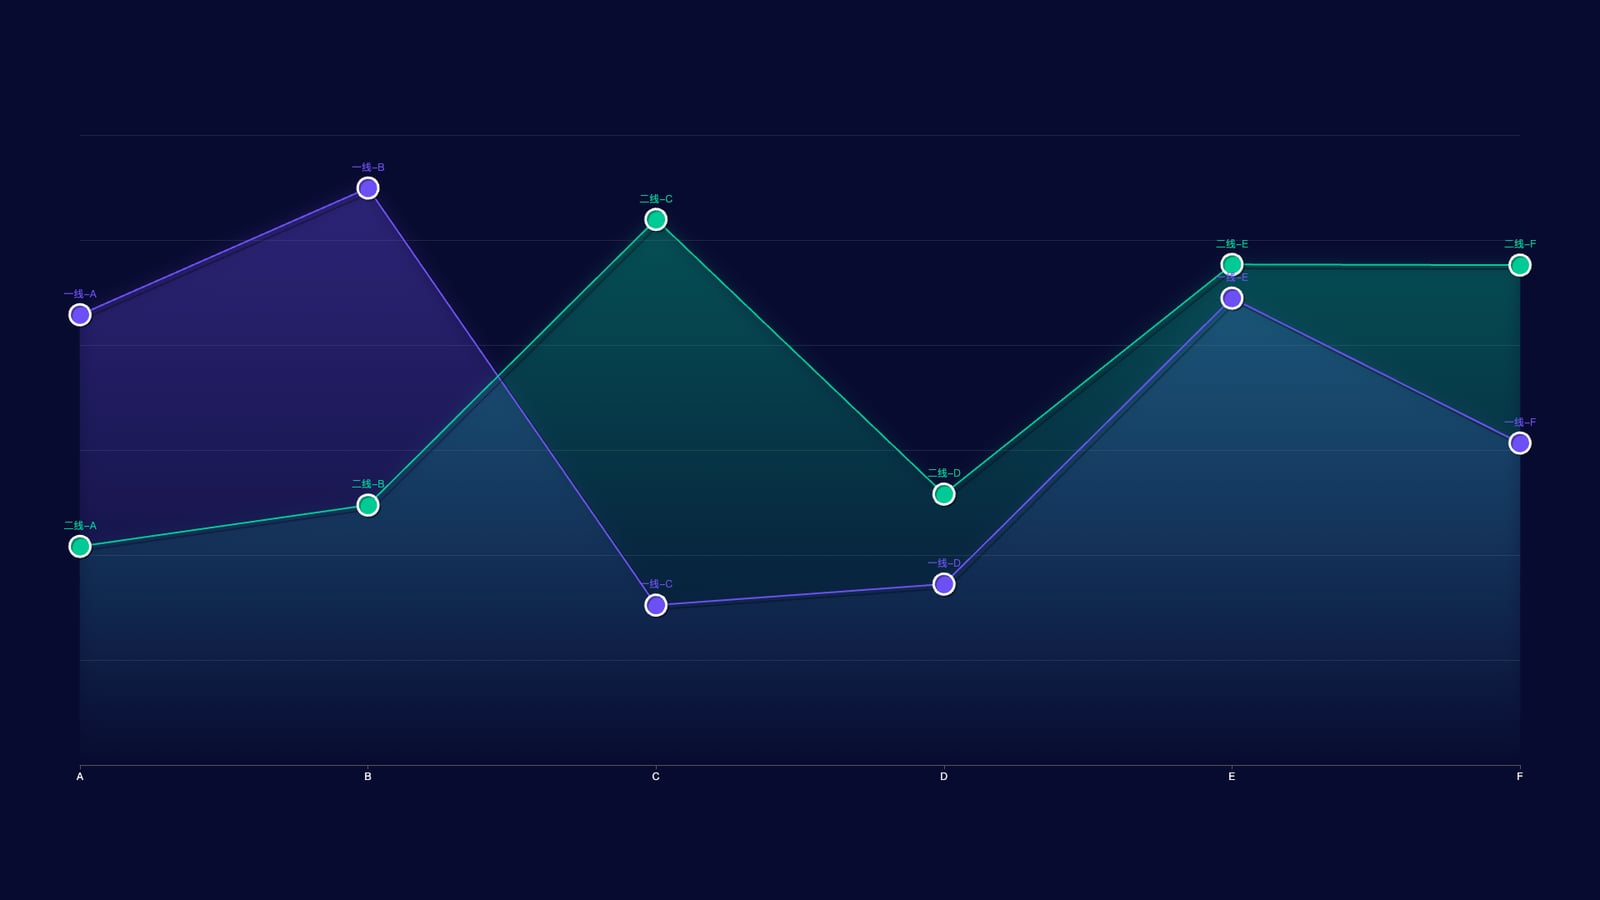
配置代码
const option = {
        tooltip: {
            trigger: 'axis',
            axisPointer: {
                lineStyle: {
                    color: {
                        type: 'linear',
                        x: 0, y: 0, x2: 0, y2: 1,
                        colorStops: [
                            { offset: 0, color: 'rgba(0, 255, 233,0)' },
                            { offset: 0.5, color: 'rgba(255, 255, 255,1)' },
                            { offset: 1, color: 'rgba(0, 255, 233,0)' }
                        ],
                        global: false
                    }
                }
            }
        },

        grid: {
            top: '15%',
            left: '5%',
            right: '5%',
            bottom: '15%'
        },

        xAxis: [{
            type: 'category',
            axisLine: { show: true },
            splitArea: {
                lineStyle: { color: '#f00' }
            },
            axisLabel: { color: '#fff' },
            splitLine: { show: false },
            boundaryGap: false,
            data: xData
        }],

        yAxis: [{
            type: 'value',
            min: 0,
            splitNumber: 4,
            splitLine: {
                show: true,
                lineStyle: { color: 'rgba(255,255,255,0.1)' }
            },
            axisLine: { show: false },
            axisLabel: { show: false },
            axisTick: { show: false }
        }],

        series: [
            {
                name: '注册总量-1',
                type: 'line',
                showAllSymbol: true,
                symbol: 'circle',
                symbolSize: 25,

                lineStyle: {
                    color: "#6c50f3",
                    shadowColor: 'rgba(0, 0, 0, .3)',
                    shadowBlur: 0,
                    shadowOffsetY: 5,
                    shadowOffsetX: 5
                },

                // 圆点上方的“标题/文案”在这里自定义:
                // label.formatter 支持函数/模板字符串,返回什么就显示什么 [web:1][web:2]
                label: {
                    show: true,
                    position: 'top',
                    color: '#6c50f3',
                    formatter: function (params) {
                        // params.dataIndex 对应当前点索引
                        const t = pointTitle1[params.dataIndex];
                        return t; // 仅显示标题;如果要加数值:return `${t}\n${params.value}`;
                    }
                },

                itemStyle: {
                    color: "#6c50f3",
                    borderColor: "#fff",
                    borderWidth: 3,
                    shadowColor: 'rgba(0, 0, 0, .3)',
                    shadowBlur: 0,
                    shadowOffsetY: 2,
                    shadowOffsetX: 2
                },

                tooltip: { show: false },

                areaStyle: {
                    color: new echarts.graphic.LinearGradient(0, 0, 0, 1, [
                        { offset: 0, color: 'rgba(108,80,243,0.3)' },
                        { offset: 1, color: 'rgba(108,80,243,0)' }
                    ], false),
                    shadowColor: 'rgba(108,80,243, 0.9)',
                    shadowBlur: 20
                },

                data: data1
            },

            {
                name: '注册总量-2',
                type: 'line',
                showAllSymbol: true,
                symbol: 'circle',
                symbolSize: 25,

                lineStyle: {
                    color: "#00ca95",
                    shadowColor: 'rgba(0, 0, 0, .3)',
                    shadowBlur: 0,
                    shadowOffsetY: 5,
                    shadowOffsetX: 5
                },

                label: {
                    show: true,
                    position: 'top',
                    color: '#00ca95',
                    formatter: function (params) {
                        const t = pointTitle2[params.dataIndex];
                        return t;
                    }
                },

                itemStyle: {
                    color: "#00ca95",
                    borderColor: "#fff",
                    borderWidth: 3,
                    shadowColor: 'rgba(0, 0, 0, .3)',
                    shadowBlur: 0,
                    shadowOffsetY: 2,
                    shadowOffsetX: 2
                },

                tooltip: { show: false },

                areaStyle: {
                    color: new echarts.graphic.LinearGradient(0, 0, 0, 1, [
                        { offset: 0, color: 'rgba(0,202,149,0.3)' },
                        { offset: 1, color: 'rgba(0,202,149,0)' }
                    ], false),
                    shadowColor: 'rgba(0,202,149, 0.9)',
                    shadowBlur: 20
                },

                data: data2
            }
        ]
    };
完整示例代码
相关文件下载地址


