ID
6
配置代码
var option = {
backgroundColor: '#0e2147',
title: {
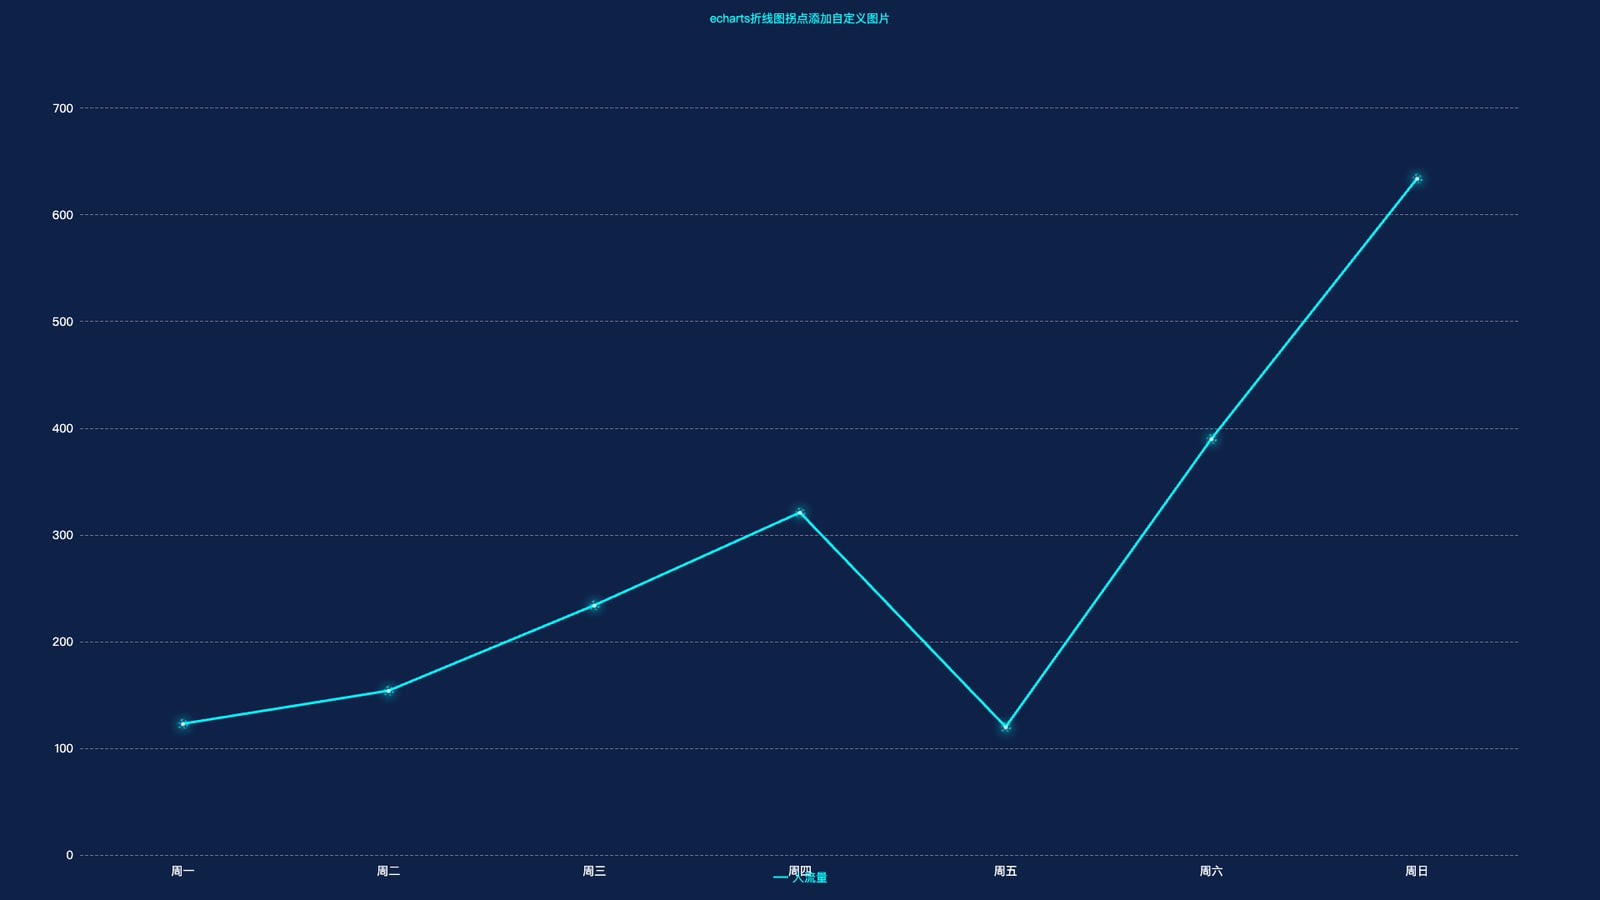
text: 'echarts折线图拐点添加自定义图片',
left: 'center',
top: 10,
textStyle: {
color: '#00ffff',
fontSize: 14,
fontWeight: 400
}
},
grid: {
left: '5%',
top: '12%',
bottom: '5%',
right: '5%',
},
tooltip: {
trigger: 'axis'
},
legend: {
type: "scroll",
data: ['人流量'],
itemWidth: 18,
itemHeight: 12,
textStyle: {
color: "#00ffff",
fontSize: 14
}
},
yAxis: [
{
type: 'value',
position: 'right',
splitLine: { show: false },
axisLine: { show: false },
axisTick: { show: false },
axisLabel: { show: false }
},
{
type: 'value',
position: 'left',
nameTextStyle: { color: '#00FFFF' },
splitLine: {
lineStyle: {
type: 'dashed',
color: 'rgba(135,140,147,0.8)'
}
},
axisLine: { show: false },
axisTick: { show: false },
axisLabel: {
formatter: '{value}',
color: '#fff',
fontSize: 14
}
},
],
xAxis: [
{
type: 'category',
axisTick: { show: false },
axisLine: {
show: false,
lineStyle: { color: '#6A989E' }
},
axisLabel: {
inside: false,
textStyle: {
color: '#fff',
fontWeight: 'normal',
fontSize: '14',
lineHeight: 22
}
},
data: XName,
},
{
type: 'category',
axisLine: { show: false },
axisTick: { show: false },
axisLabel: { show: false },
splitArea: { show: false },
splitLine: { show: false },
data: ['1月', '2月', '3月', '4月', '5月', '6月'],
},
],
series: [
{
name: '人流量',
type: 'line',
yAxisIndex: 1,
// 拐点用自定义图片:symbol 支持 image://dataURI [web:18]
symbol: imgOne,
symbolSize: 100,
smooth: false,
lineStyle: { width: 3, color: '#00f8ff' },
itemStyle: {
color: '#00f8ff',
borderWidth: 3
},
data: peopleFlow
}
]
};
完整示例代码
相关文件下载地址


