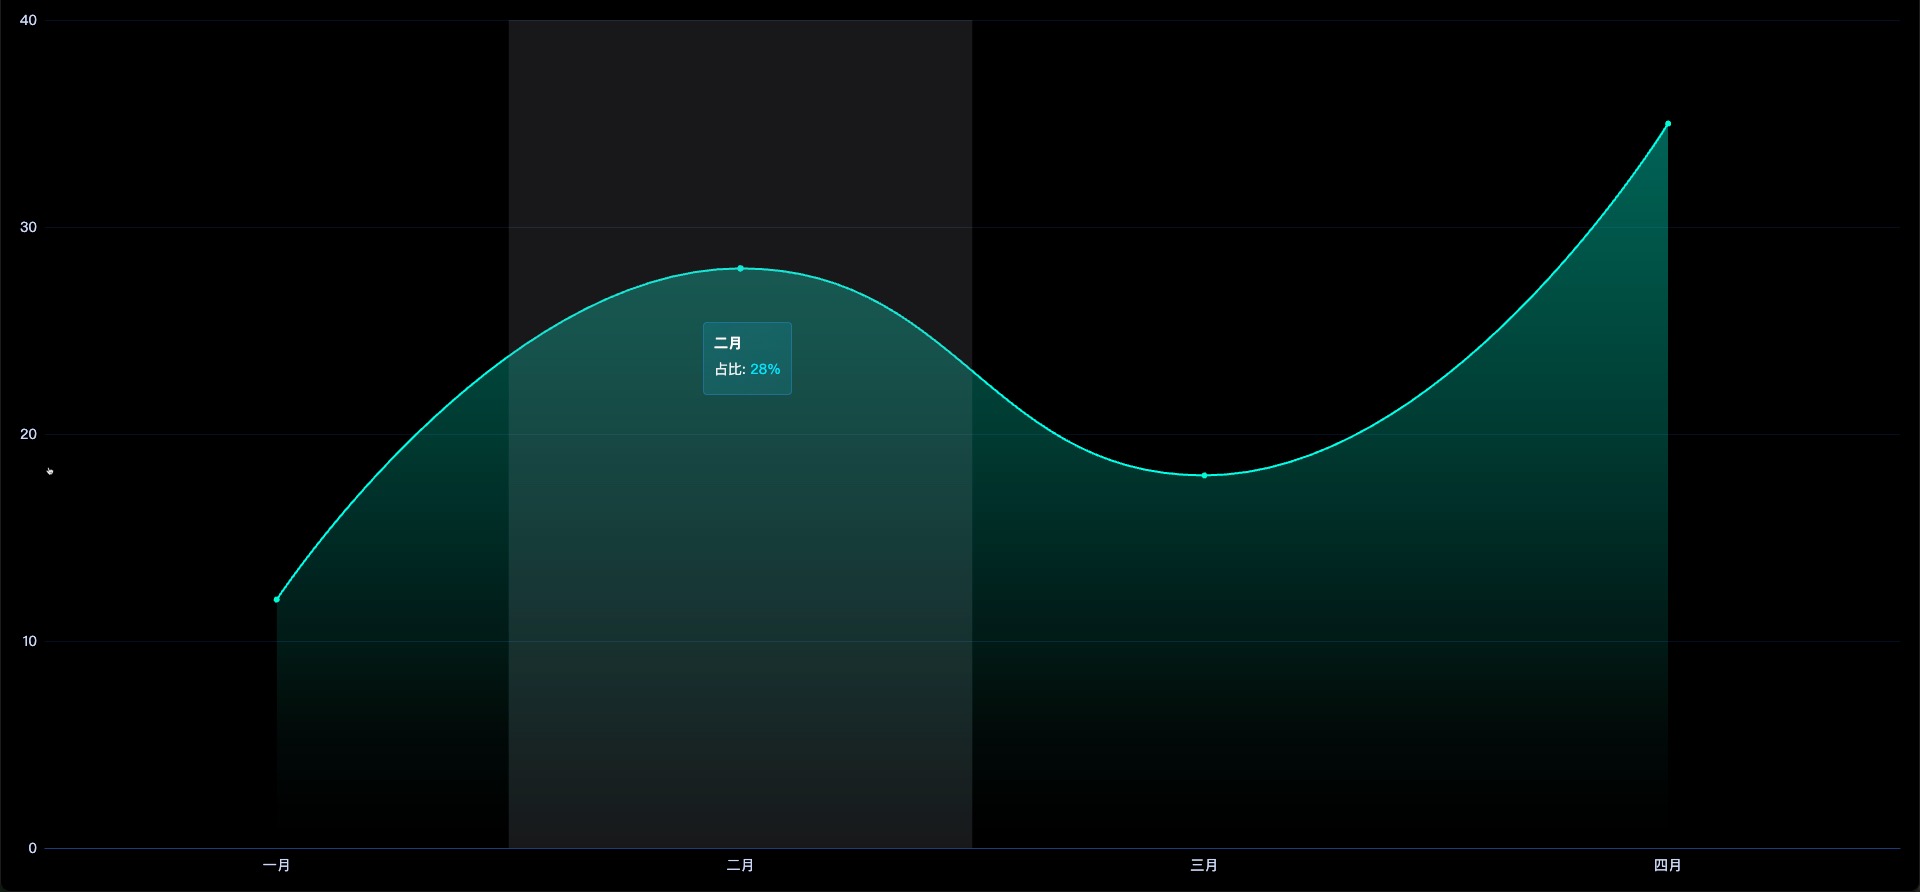
echarts实现tooltip自定义样式
id
1
const option = {
            grid: {
                top: '20px',
                bottom: '20px',
                left: '20px',
                right: '20px',
                containLabel: true
            },
            tooltip: {
                trigger: 'axis',
                axisPointer: { type: 'shadow' },
                backgroundColor: 'transparent',
                borderColor: 'transparent',
                borderWidth: 0,
                padding: 0,
                textStyle: { color: '#ffffff' },
                extraCssText: 'box-shadow: none;',
                formatter: function (params) {
                    return `
              <div style="
                backdrop-filter: blur(10px);
                -webkit-backdrop-filter: blur(10px);
                background: linear-gradient(
                  135deg,
                  rgba(9,168,193,0.2) 0%,
                  rgba(9,168,193,0.15) 100%
                );
                border-radius: 4px;
                padding: 10px;
                border: 1px solid rgba(50, 150, 250, 0.3);
                box-shadow: none;
              ">
                <div style="
                  font-weight: bold;
                  margin-bottom: 5px;
                  color: rgba(255,255,255,1);
                ">${params[0].name}</div>
                <div style="color: rgba(255,255,255,0.9); margin: 4px 0;">
                  ${params[0].seriesName}:
                  <span style="color: #00E5FF">${params[0].data}%</span>
                </div>
              </div>
            `;
                }
            },
            xAxis: [{
                data: list.map(obj => obj.name),
                axisLabel: {
                    margin: 10,
                    color: 'rgba(202, 215, 245, 1)',
                    textStyle: { fontSize: FontChart(14) }
                },
                axisLine: { lineStyle: { color: '#1c3e7a', width: 1 } },
                splitLine: { show: false },
                axisTick: { show: false }
            }],
            yAxis: [{
                axisLabel: {
                    color: 'rgba(202, 215, 245, 1)',
                    textStyle: { fontSize: FontChart(14) }
                },
                axisLine: { lineStyle: { color: 'rgba(49, 119, 214, 1)' } },
                axisTick: { show: false },
                splitLine: {
                    show: true,
                    lineStyle: { color: 'rgba(39, 76, 129, 0.26)', width: 1 }
                }
            }],
            series: [{
                name: seriesName,
                type: 'line',
                data: list.map(obj => obj.value),
                smooth: true,
                symbol: 'circle',
                itemStyle: {
                    color: '#00fbd3',
                    lineStyle: { color: '#00fbd3', width: 1 }
                },
                areaStyle: {
                    color: new echarts.graphic.LinearGradient(0, 0, 0, 1, [
                        { offset: 0, color: 'rgba(0, 240, 203, 0.5)' },
                        { offset: 1, color: 'rgba(0, 240, 203, 0)' }
                    ], false)
                }
            }]
        };
完整实例代码
相关文件下载地址


