js 通过经纬度数组获取中心点

echarts yekong 481℃

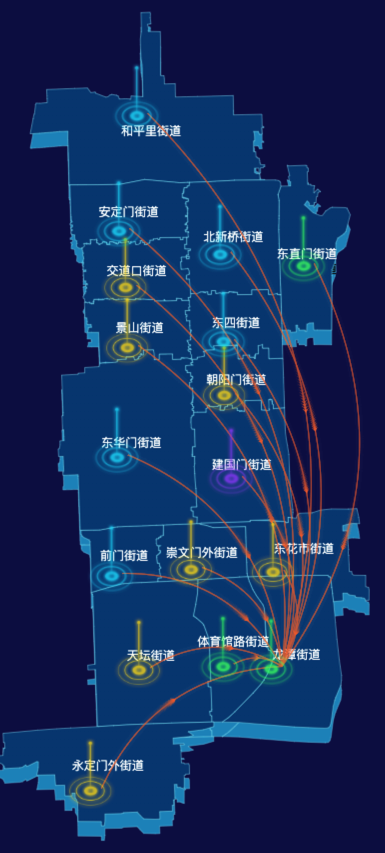
vue项目外包中,经常需要通过echarts来渲染地图,但是echarts在渲染地图时,需要渲染一些标注信息,比如图标或者名称,但是geojson并没有提供中心点,所以就想着使用js通过经纬度数组获取一个中心点,来做标注信息的位置点。

js 通过经纬度数组获取中心点

js

function getCenter(arr) {
        let centerLonLat = []
        if (arr.length) {
            const lon = []
            const lat = []
            const poly = [];
            for (let i = 0, len = arr.length; i < len; i++) {
                lon.push(arr[i][0])
                lat.push(arr[i][1])
            }
            for (let i = 0, len = lon.length; i < len; i++) {
                poly.push({
                    x: parseFloat(lon[i]),
                    y: parseFloat(lat[i]),
                    z: 0
                });
            }
            const sortedLongitudeArray = poly.map(item => item.x).sort();
            const sortedLatitudeArray = poly.map(item => item.y).sort();
            const centerLongitude = ((parseFloat(sortedLongitudeArray[0]) + parseFloat(sortedLongitudeArray[sortedLongitudeArray.length - 1])) / 2).toFixed(14);
            const centerLatitude = ((parseFloat(sortedLatitudeArray[0]) + parseFloat(sortedLatitudeArray[sortedLatitudeArray.length - 1])) / 2).toFixed(14);
            console.log(centerLongitude, centerLatitude);
            centerLonLat = [Number(centerLongitude), Number(centerLatitude)]
        }
        return centerLonLat;
    }

使用

function getEcharts(data) {
        var chartDom = document.getElementById('echarts');
        var myChart = echarts.init(chartDom);
        var nameMap = '地图数据';
        var geoCoordMap = {};
        var mapData = [];
        // 图标数据
        var iconData = [];
        echarts.registerMap(nameMap, data);
        /*获取地图数据*/
        myChart.showLoading();
        var mapFeatures = echarts.getMap(nameMap).geoJson.features;
        myChart.hideLoading();
        mapFeatures.forEach(function (v, index) {
            console.log(v.geometry.coordinates[0])
            // 地区名称
            mapData.push({
                name: v.properties.name,
                value: Math.random() * 100
            });
            var name = v.properties.name;
            geoCoordMap[name] = getCenter(v.geometry.coordinates[0]);
            var data = {
                "value": getCenter(v.geometry.coordinates[0]),
                "id": index,
                "name": name,
            }
            iconData.push(data)
        });

// 生成飞线数据
        var fData = []
        for (var key in geoCoordMap) {
            for (var key1 in geoCoordMap) {
                if (key1 != key) {
                    fData.push({
                        coords: [
                            geoCoordMap[key],
                            geoCoordMap[key1],
                        ],
                        fromName: key,
                        toName: key1,
                    })
                    break
                }
            }
        }
        fData.splice(0, 1)

        var serverdata = [
            {
                type: 'lines',
                zlevel: 3,
                effect: {
                    show: true,
                    period: 4, //箭头指向速度,值越小速度越快
                    trailLength: 0.1, //特效尾迹长度[0,1]值越大,尾迹越长重
                    symbol: 'arrow', //箭头图标
                    symbolSize: 4, //图标大小
                },
                tooltip: {
                    trigger: 'item',
                },
                label: {
                    show: false,
                    color: '#fff',
                    emphasis: {
                        color: 'white',
                        show: true
                    }
                },
                lineStyle: {
                    normal: {
                        color: '#F46E36',
                        width: 0.5, //尾迹线条宽度
                        opacity: 0.5, //尾迹线条透明度
                        curveness: 0.3 //尾迹线条曲直度
                    }
                },
                data: fData,
            },
            { // 地图块的相关信息
                type: 'map',
                map: nameMap,
                zoom: 1,
                roam: false,
                z: 1,
                aspectScale: 0.75,
                layoutCenter: ["50%", "50%"],
                layoutSize: '100%',
                itemStyle: {
                    normal: {
                        borderColor: 'rgba(147, 235, 248, 1)',
                        borderWidth: 0.5,
                        opacity: 1,
                        areaColor: {
                            type: 'linear-gradient',
                            x: 0,
                            y: 1200,
                            x2: 1000,
                            y2: 0,
                            colorStops: [{
                                offset: 0,
                                color: '#004881' // 0% 处的颜色
                            }, {
                                offset: 1,
                                color: '#004881' // 50% 处的颜色
                            }],
                            global: true // 缺省为 false
                        },
                    },
                    emphasis: {
                        areaColor: '#013159',
                        label: {
                            show: true,
                            color: 'rgba(255, 255, 255, 1)',
                            fontSize: 14
                        },
                    }
                },
                label: {
                    show: true,
                    normal: {
                        show: true,
                        textStyle: {
                            fontSize: 12,
                            fontWeight: 400,
                            color: '#fff'
                        }
                    }
                },
                data: mapData
            }
        ]

        // 生成地图图标
        iconData.forEach((type, index) => {
            var datamap = {
                type: 'scatter',
                tooltip: {
                    show: true,
                    formatter: function (params) {
                        return params.data.name + '分行';
                    }
                },
                name: type.name,
                coordinateSystem: 'geo',
                symbol: 'image://' + iconList[Math.floor(Math.random() * 4)],
                symbolSize: [49, 71],
                symbolOffset: [-11, -15],
                label: {
                    normal: {
                        show: false,
                        textStyle: {
                            color: '#000',
                            fontSize: 10,
                            fontWeight: 600
                        },
                        formatter(value) {
                            return 100
                        }
                    }
                },
                hoverAnimation: true,
                zlevel: 6,
                data: [type]
            }
            serverdata.push(datamap)
        });
        var optionMap = {
            geo: {
                map: nameMap,
                show: true,
                aspectScale: 0.75,
                layoutCenter: ["50%", "51.5%"],
                layoutSize: '100%',
                roam: false,
                itemStyle: {
                    normal: {
                        borderColor: 'rgba(147, 235, 248, 1)',
                        borderWidth: 0.5,
                        color: {
                            type: 'linear-gradient',
                            x: 0,
                            y: 1500,
                            x2: 2500,
                            y2: 0,
                            colorStops: [{
                                offset: 0,
                                color: '#1EB5E2' // 0% 处的颜色
                            }, {
                                offset: 1,
                                color: '#1EB5E2' // 50% 处的颜色
                            }],
                            global: true // 缺省为 false
                        },
                        opacity: 0.8,
                    },
                    emphasis: {
                        areaColor: '#2a333d'
                    }
                },
                z: 0,
                label: {
                    normal: {
                        show: true
                    },
                    emphasis: {
                        show: false
                    }
                }
            },
            series: serverdata
        };
        myChart.setOption(optionMap);
    }
喜欢 (0)