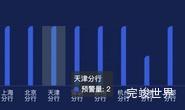
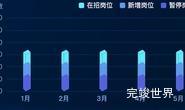
效果图

柱状图运行实例
柱状图代码
<template>
  <div class="echarts1" ref="echarts">

  </div>
</template>

<script>

import {FontChart} from "@/utils/utils";

export default {
  name: 'echarts1',
  components: {},
  props: {
    id: {
      type: String,
      default() {
        return ''
      }
    }
  },
  data() {
    return {
      active: false
    }
  },
  watch: {},
  mounted() {
    this.drawLine()
  },
  methods: {
    drawLine() {
      var that = this;
      // 基于准备好的dom,初始化echarts实例
      window.addEventListener('resize', this.drawLine)
      let myChart = this.$echarts.init(this.$refs.echarts)
      var option = {
        grid: {
          left: "30",
          right: "3%",
          top: 50,
          bottom: "50",
          containLabel: true,
        },

        "dataZoom": [
          {
            "show": true,
            "height": 12,
            "xAxisIndex": [
              0
            ],
            bottom: '30',
            "start": 10,
            "end": 90,
            handleStyle: {
              color: "#d3dee5",

            },
            textStyle: {
              color: "#fff"
            },
            borderColor: "#90979c"
          }],
        legend: {
          right: '30',
          top: '15',
          show: true,
          itemWidth: 15,
          itemHeight: 15,
          textStyle: {
            color: 'rgba(168, 230, 243, 1)'
          },
          itemGap: 20,
        },
        tooltip: {
          show: true,
          trigger: 'axis',
        },
        xAxis: [
          {
            data: [
              "高邑",
              "井陉",
              "元氏",
              "鹿泉",
              "赞皇"
            ],
            axisLine: {
              lineStyle: {
                color: "rgba(77, 85, 133, 1)",
              },
            },
            axisTick: {
              show: false,
            },
            axisLabel: {
              color: "#fff",
              fontSize: FontChart(14),
            },
          },
        ],
        yAxis: [
          {
            axisLine: {
              show: true,
              lineStyle: {
                color: "rgba(77, 85, 133, 1)",
              },
            },
            axisTick: {
              show: false,
            },
            axisLabel: {
              color: "#fff",
              fontSize: FontChart(14),
            },
            splitLine: {
              show: true,
              lineStyle: {
                color: "rgba(45, 84, 138, 1)",
              },
            },
            yAxisIndex: 0,
          },
        ],
        series: [
          {
            name: "统计1",
            type: "bar",
            barWidth: FontChart(35),
            zlevel: 2,
            itemStyle: {
              normal: {
                barBorderRadius: 0,
                color: new that.$echarts.graphic.LinearGradient(
                  0,
                  0,
                  0,
                  1,
                  [
                    {
                      offset: 0,
                      // color: "#0385E9",
                      color: "#E09900",
                    },
                    {
                      offset: 1,
                      color: "#E09900",
                    },
                  ],
                  false
                ),
              },
            },
            label: {
              normal: {
                show: true,
                fontSize: 14,
                fontWeight: "bold",
                color: "#ffffff",
                position: "top",
              },
            },
            data: [60, 79, 90, 13, 60, 80, 80, 60, 79, 90, 13, 60, 80],
          },
          {
            name: "统计2",
            type: "bar",
            barWidth: FontChart(35),
            zlevel: 2,
            yAxisIndex: 0,
            itemStyle: {
              normal: {
                barBorderRadius: 0,
                color: new that.$echarts.graphic.LinearGradient(
                  0,
                  0,
                  0,
                  1,
                  [
                    {
                      offset: 0,
                      color: "#EC4848",
                    },
                    {
                      offset: 1,
                      color: "#EC4848",
                    },
                  ],
                  false
                ),
              },
            },
            label: {
              normal: {
                show: true,
                fontSize: 14,
                fontWeight: "bold",
                color: "#ffffff",
                position: "top",
              },
            },
            data: [60, 79, 90, 13, 60, 80, 80, 60, 79, 90, 13, 60, 80],
          },
        ],
      };
      myChart.clear()
      myChart.resize()
      myChart.setOption(option)
    },
  }
}
</script>

<style lang="scss" scoped>
.echarts1 {
  position: relative;
  width: 100%;
  height: 100%;
  margin-top: -30px;
}
</style>