drawLine () {
var that = this
window.addEventListener('resize', this.drawLine)
let myChart = this.$echarts.init(this.$refs.echarts)
var option = {
tooltip: {
trigger: 'axis',
axisPointer: {
type: 'shadow'
}
},
legend: {
itemWidth: 10,
itemHeight: 10,
itemGap: 13,
show: false,
right: 20,
textStyle: {
fontSize: 12,
color: '#F1F1F3'
}
},
grid: {
left: '3%',
top: '18%',
right: '4%',
bottom: '3%',
containLabel: true
},
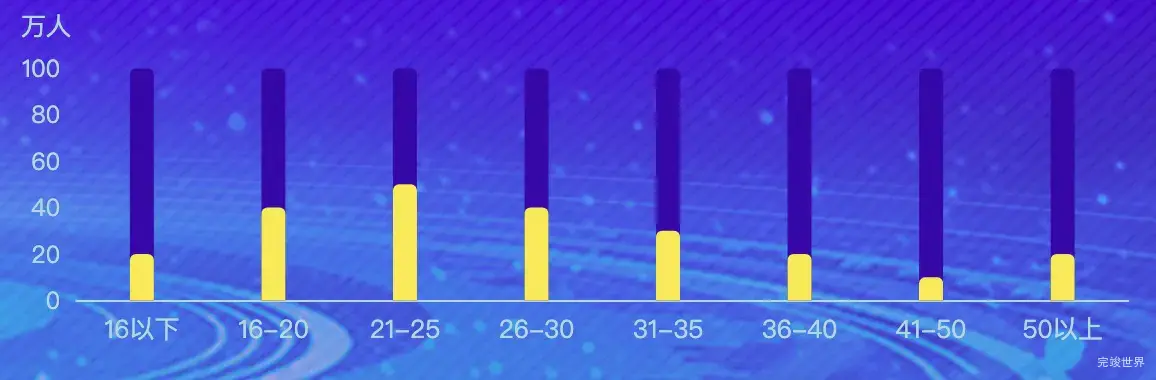
xAxis: [{
type: 'category',
data: [
'16以下',
'16-20',
'21-25',
'26-30',
'31-35',
'36-40',
'41-50',
'50以上'
],
axisLine: {
show: true,
lineStyle: {
color: 'rgba(179, 216, 221, 1)',
width: 1,
type: 'solid'
}
},
splitLine: {
show: false,
lineStyle: {
type: 'dashed',
color: '#315070',
}
},
axisTick: {
show: false,
},
axisLabel: {
show: true,
interval: 0,
rotate: 0,
textStyle: {
color: 'rgba(179, 216, 221, 1)',
fontSize: FontChart(12)
}
},
}],
yAxis: [{
type: 'value',
name: '万人',
nameTextStyle: {
fontSize: FontChart(12),
color: 'rgba(179, 216, 221, 1)',
padding: [0, 0, 0, -30]
},
axisLabel: {
formatter: '{value}',
textStyle: {
color: 'rgba(179, 216, 221, 1)',
}
},
axisTick: {
show: false,
},
axisLine: {
show: false,
lineStyle: {
color: '#00c7ff',
width: 1,
type: 'solid'
},
},
splitLine: {
show: false,
lineStyle: {
color: '#063374',
}
}
}, {
type: 'value',
axisLabel: {
formatter: '{value}',
textStyle: {
color: 'rgba(179, 216, 221, 1)',
}
},
axisTick: {
show: false,
},
axisLine: {
show: false,
lineStyle: {
color: '#00c7ff',
width: 1,
type: 'solid'
},
},
splitLine: {
show: false,
lineStyle: {
color: '#063374',
}
}
}],
series: [
{
name: '省外',
type: 'bar',
data: [20, 40, 50, 40, 30, 20, 10, 20],
barWidth: '12',
yAxisIndex: 0,
barGap: 0,
zlevel: 1,
itemStyle: {
normal: {
color: 'rgba(255, 229, 53, 1)',
opacity: 1,
barBorderRadius: [3, 3, 0, 0],
}
}
},
{
name: '',
type: 'bar',
barWidth: 12,
xAxisIndex: 0,
barGap: '-100%',
itemStyle: {
normal: {
color: 'rgba(14, 35, 173, 1)',
barBorderRadius: [3, 3, 0, 0],
},
},
label: {
normal: {
show: false,
fontSize: 18,
fontWeight: 'bold',
color: '#ffffff',
position: 'top',
},
},
data: [100, 100, 100, 100, 100, 100, 100, 100, 100],
},
]
}
myChart.clear()
myChart.resize()
myChart.setOption(option)
},