vue2 数据可视化大屏 智慧医院数据监控中心
id
319
运行环境
nodejs 23
开发框架
vue2 vite js
分辨率
1920*1080
演示地址
vue2 数据可视化大屏 智慧医院数据监控中心
演示demo:vue2 数据可视化大屏 智慧医院数据监控中心
效果截图

视频演示
今日关键指标
数字卡片展示今日关键指标
今日接诊患者
在岗医护人员
床位使用率
急诊病例

床位使用情况
饼状图展示床位使用情况
已使用
空闲
维修中

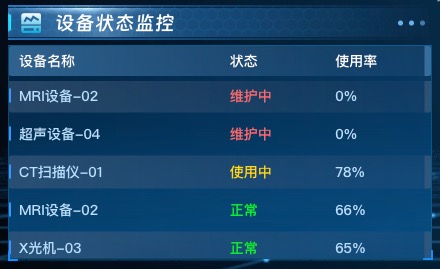
设备状态监控
滚动列表展示设备状态监控
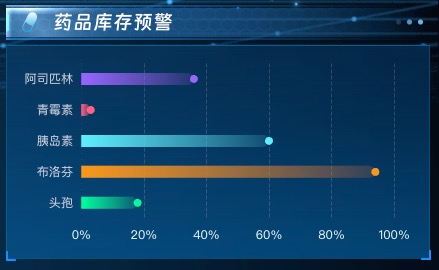
药品库存预警
横向柱状图展示药品库存预警
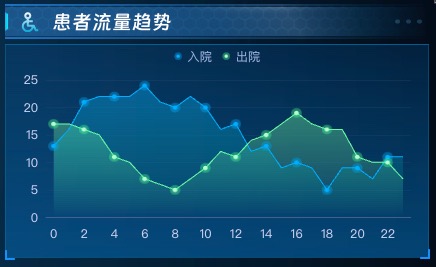
患者流量趋势
折线图展示患者流量趋势
实时通知
滚动列表展示实时通知

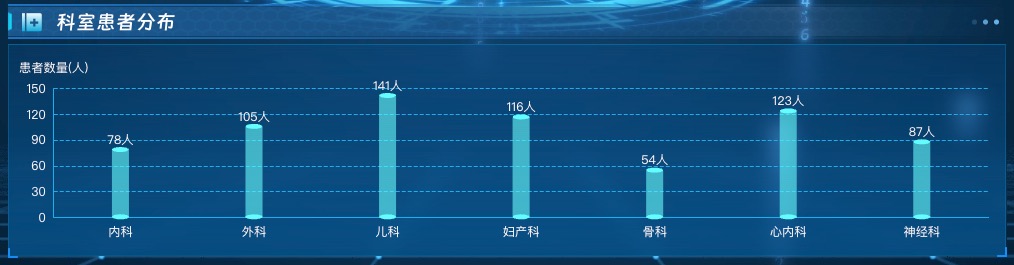
科室患者分布
柱状图展示科室患者分布
项目依赖
{
  "name": "319_zhihuiyiyuan_vue2",
  "private": true,
  "version": "0.0.0",
  "type": "module",
  "scripts": {
    "dev": "vite",
    "build": "vite build",
    "build-qiniu": "vite build && node ./qiniu.js",
    "preview": "vite preview"
  },
  "dependencies": {
    "@meruem117/vue-seamless-scroll": "^0.0.19",
    "@vitejs/plugin-vue": "^6.0.1",
    "@vue/composition-api": "^1.7.2",
    "autoprefixer": "^10.4.21",
    "core-js": "^3.34.0",
    "dayjs": "^1.11.7",
    "echarts": "^5.4.3",
    "echarts-extension-amap": "^1.12.0",
    "echarts-gl": "^2.0.9",
    "fs": "0.0.1-security",
    "gsap": "^3.11.4",
    "path": "^0.12.7",
    "postcss": "^8.4.21",
    "postcss-loader": "^7.0.2",
    "postcss-pxtorem": "^5.1.1",
    "qiniu": "^7.8.0",
    "qs": "^6.10.1",
    "sass": "^1.57.1",
    "three": "^0.180.0",
    "vite-plugin-vue2": "^2.0.3",
    "vue": "2.6.14",
    "vue-router": "^3.0.1",
    "wow.js": "^1.2.2"
  },
  "devDependencies": {
    "@vitejs/plugin-vue2": "^2.2.0",
    "vite": "^4.0.0",
    "vue-template-compiler": "2.6.14"
  }
}
部分代码
<template>
  <div class="echarts1" ref="echartsRef">
  </div>
</template>

<script>
import * as echarts from "echarts"
import { FontChart } from "@/utils/utils.js"

export default {
  name: 'DepartmentChart',
  props: {
    name: {
      type: String,
      default: '科室患者分布'
    },
    list: {
      type: Array,
      default: () => [
        { name: '内科', value: Math.floor(Math.random() * 100) + 50 },
        { name: '外科', value: Math.floor(Math.random() * 100) + 50 },
        { name: '儿科', value: Math.floor(Math.random() * 100) + 50 },
        { name: '妇产科', value: Math.floor(Math.random() * 100) + 50 },
        { name: '骨科', value: Math.floor(Math.random() * 100) + 50 },
        { name: '心内科', value: Math.floor(Math.random() * 100) + 50 },
        { name: '神经科', value: Math.floor(Math.random() * 100) + 50 }
      ]
    }
  },
  data() {
    return {
      myChart: null
    }
  },
  watch: {
    list: {
      handler() {
        this.$nextTick(() => {
          this.drawEcharts()
        })
      },
      deep: true
    }
  },
  mounted() {
    this.$nextTick(() => {
      this.drawEcharts()
    })
  },
  beforeDestroy() {
    if (this.myChart) {
      window.removeEventListener('resize', this.handleResize)
      this.myChart.dispose()
    }
  },
  methods: {
    // 工具方法
    getRandomInt(min, max) {
      return Math.floor(Math.random() * (max - min + 1)) + min
    },

    // 处理窗口大小变化
    handleResize() {
      if (this.myChart) {
        this.myChart.resize()
      }
    },

    // 绘制图表方法
    drawEcharts() {
      if (!this.$refs.echartsRef) return

      if (!this.myChart) {
        this.myChart = echarts.init(this.$refs.echartsRef)
        // 添加窗口resize监听
        window.addEventListener('resize', this.handleResize)
      }

      // 如果没有传入list数据,使用默认随机数据
      const chartData = this.list && this.list.length > 0 ? this.list : [
        { name: '内科', value: this.getRandomInt(80, 200) },
        { name: '外科', value: this.getRandomInt(60, 180) },
        { name: '儿科', value: this.getRandomInt(40, 120) },
        { name: '妇产科', value: this.getRandomInt(50, 150) },
        { name: '骨科', value: this.getRandomInt(30, 100) },
        { name: '心内科', value: this.getRandomInt(70, 160) },
        { name: '神经科', value: this.getRandomInt(45, 130) }
      ]

      const option = {
        grid: {
          top: FontChart(50),
          bottom: FontChart(20),
          left: FontChart(20),
          right: FontChart(20),
          containLabel: true
        },
        tooltip: {
          show: true,
          trigger: 'axis',
          formatter: function(params) {
            return params[0].name + '<br/>患者数量: ' + params[0].value + '人'
          }
        },
        xAxis: {
          data: chartData.map(obj => obj.name),
          axisLine: {
            lineStyle: {
              color: '#1dafef'
            }
          },
          axisTick: {
            show: false
          },
          axisLabel: {
            color: 'rgba(255, 255, 255, 1)',
            fontSize: FontChart(14)
          }
        },
        yAxis: [
          {
            name: '患者数量(人)',
            nameTextStyle: {
              color: 'rgba(255, 255, 255, 1)',
              fontSize: FontChart(14)
            },
            axisLine: {
              show: true,
              lineStyle: {
                color: '#1dafef'
              }
            },
            axisTick: {
              show: false
            },
            axisLabel: {
              color: 'rgba(255, 255, 255, 1)',
              fontSize: 12
            },
            splitLine: {
              show: true,
              lineStyle: {
                color: '#1dafef',
                type: 'dashed'
              }
            },
            yAxisIndex: 0
          }
        ],
        series: [
          {
            "name": "",
            "type": "pictorialBar",
            "symbolSize": [17, 5],
            "symbolOffset": [0, -3],
            "z": 12,
            "symbolPosition": "end",
            tooltip: {
              show: false
            },
            itemStyle: {
              color: 'rgba(99, 254, 255, 1)',
              opacity: 1
            },
            "data": chartData.map(() => 0)
          },
          {
            name: this.name,
            type: 'bar',
            stack: '总量',
            barWidth: 17,
            itemStyle: {
              normal: {
                color: new echarts.graphic.LinearGradient(
                  0, 1, 0, 0,
                  [
                    {offset: 0, color: 'rgba(99, 254, 255, 0.57)'},
                    {offset: 1, color: 'rgba(99, 254, 255, 0.57)'}
                  ]
                ),
                borderRadius: [0.0, 0, 0]
              }
            },
            data: chartData.map(obj => obj.value),
            label: {
              show: true,
              position: 'top',
              color: 'rgba(255, 255, 255, 1)',
              fontSize: FontChart(14),
              formatter: '{c}人'
            },
            markPoint: {
              symbol: 'path://M112 512a400 240 0 1 0 800 0 400 240 0 1 0-800 0Z',
              symbolSize: [17, 5],
              itemStyle: {
                color: 'rgba(99, 254, 255, 1)'
              },
              data: chartData.map((obj, index) => ({
                xAxis: index,
                yAxis: obj.value + 1
              }))
            }
          }
        ]
      }

      this.myChart.clear()
      this.myChart.resize()
      this.myChart.setOption(option)
    }
  }
}
</script>

<style lang="scss" scoped>
.echarts1 {
  position: relative;
  width: 100%;
  height: calc(100% - 0px);
}
</style>
大屏数据可视化模板
更多背景图资源
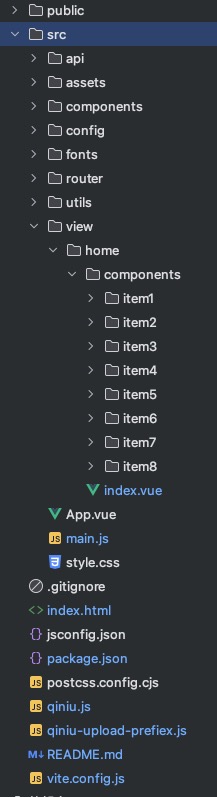
项目文件目录
源码下载
项目基于vue2+vite+js开发 nodejs 23
获取代码前请确保具备相关开发基础
本项目为纯前端大屏,无后端支持
默认数据为模拟数据,实际使用时需接入真实数据源
请在确认需求后再获取相关代码
如需vue3版本请访问:智慧医院数据监控中心 - 数据可视化大屏 vue3


