代码
/**
* @Author: 858834013@qq.com
* @Name: index
* @Date: 2022-03-13
* @Desc:
*/
<template>
<div class="parameter">
<div class="list">
<Echarts :number="item.number" :number2="item.number2" :color="item.color" :color2="item.color2"
:title="item.title" class="listEcharts"
v-for="(item,index) in list" :key="index"></Echarts>
</div>
</div>
</template>
<script>
import Echarts from './Echarts'
export default {
name: 'parameter',
components: {
Echarts,
},
props: {
id: {
type: String,
default () {
return ''
}
}
},
data () {
return {
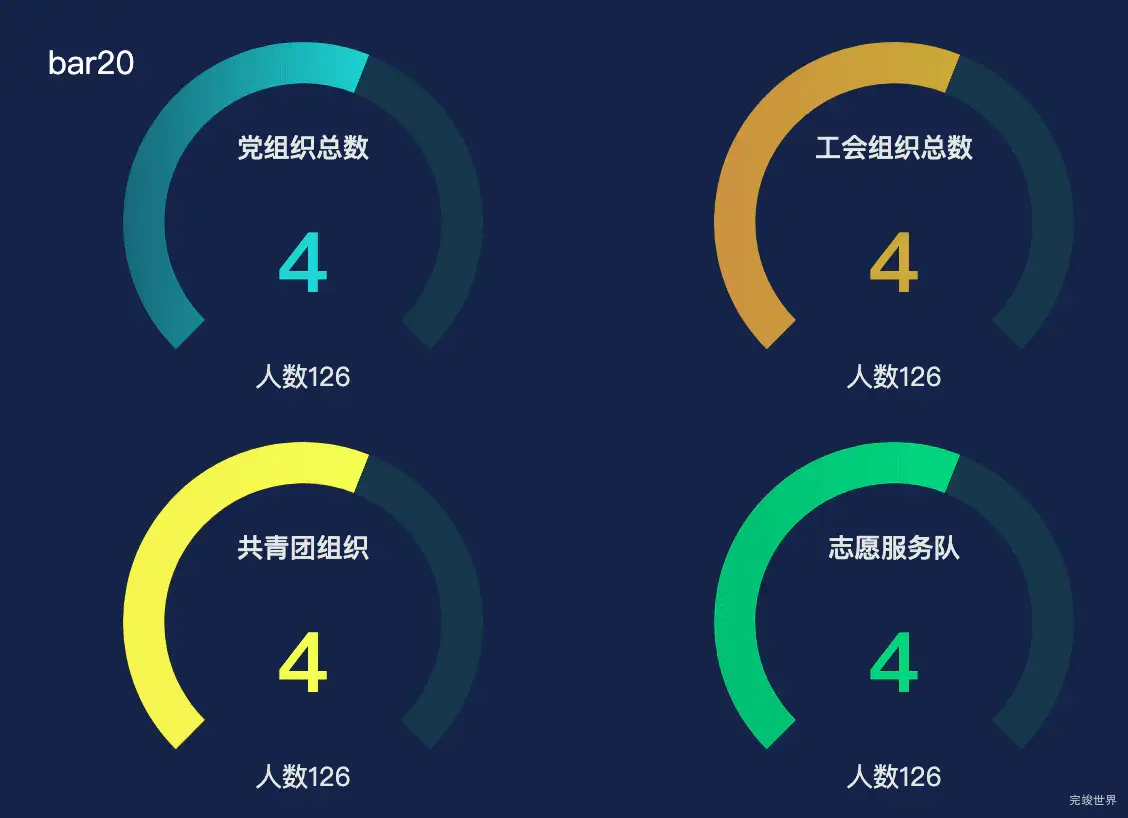
list: [{
title: '党组织总数',
number: 4,
number2: 126,
color: '#04D7D3',
color2: '#06697B',
}, {
title: '工会组织总数',
number: 4,
number2: 126,
color: '#CFA510',
color2: '#CF8B2F',
}, {
title: '共青团组织',
number: 4,
number2: 126,
color: '#FCFB06',
color2: '#FEEF00',
}, {
title: '志愿服务队',
number: 4,
number2: 126,
color: '#2DD774',
color2: '#26BE68',
}]
}
},
mounted () {
new this.$wow.WOW().init()
},
watch: {},
methods: {}
}
</script>
<style lang="scss" scoped>
.parameter {
width: 100%;
height: 100%;
display: flex;
justify-content: flex-start;
align-items: flex-start;
flex-wrap: nowrap;
flex-direction: column;
}
.list {
position: relative;
width: 100%;
height: calc(100% - 0px);
display: flex;
justify-content: center;
align-items: center;
flex-wrap: wrap;
flex-direction: row;
.listEcharts {
width: 50%;
height: 50%;
position: relative;
}
}
</style>
Echarts
<template>
  <div class="echarts1" ref="echarts1">

  </div>
</template>

<script>

import { FontChart } from '@/utils/utils'
import _ from 'lodash'

export default {
  name: 'echarts1',
  components: {},
  data () {
    return {}
  },
  props: {
    title: {
      type: String,
      default () {
        return ''
      }
    },
    color: {
      type: String,
      default () {
        return ''
      }
    },
    color2: {
      type: String,
      default () {
        return ''
      }
    },
    number: {
      type: String,
      default () {
        return ''
      }
    },
    number2: {
      type: String,
      default () {
        return ''
      }
    },
  },
  mounted () {
    var that = this
    _.delay(function (text) {
      that.drawLine()
    }, 1000, 'later')
  },
  methods: {
    drawLine () {
      var that = this
      window.addEventListener('resize', this.drawLine)
      let myChart = this.$echarts.init(this.$refs.echarts1)
      var dataArr = [{
        value: 135,
        name: ''
      }]
      var color = new this.$echarts.graphic.LinearGradient(0, 0, 1, 0, [{
        offset: 0,
        color: that.color2
      },
        {
          offset: 1,
          color: that.color
        }
      ])
      var colorSet = [
        [0.58, color],
        [1, '#0E394D']
      ]
      var rich = {
        title: {
          fontSize: FontChart(16),
          fontFamily: 'DigitalDismay',
          color: '#E3E6E7',
          fontWeight: '500',
          padding: [0, FontChart(0), 40, 0],
        },
        title2: {
          fontSize: FontChart(50),
          fontFamily: 'DigitalDismay',
          color: that.color,
          fontWeight: '700',
          padding: [0, FontChart(0), 0, 0],
        },
        numberPeople: {
          fontSize: FontChart(16),
          fontFamily: 'DigitalDismay',
          color: '#E3E6E7',
          fontWeight: '400',
          padding: [0, FontChart(0), 0, 0],
        },
      }
      var option = {
        tooltip: {
          formatter: '{a} <br/>{b} : {c}%'
        },
        series: [
          {
            type: 'gauge',
            radius: '90%',
            startAngle: '225',
            endAngle: '-45',
            pointer: {
              show: false
            },
            detail: {
              formatter: function (value) {
                return '{title|' + that.title + '}\n\n{title2|' + that.number + '}\n\n{numberPeople|人数' + that.number2 + '}'
              },
              rich: rich,
              'offsetCenter': ['0%', '0%'],
            },
            data: dataArr,
            title: {
              show: false,
              color: '#fff',
              fontStyle: 'normal',
              fontWeight: 'normal',
              fontFamily: '微软雅黑',
              fontSize: FontChart(20),
            },
            axisLine: {
              show: true,
              lineStyle: {
                color: colorSet,
                width: FontChart(25),
                shadowOffsetX: 0,
                shadowOffsetY: 0,
                opacity: 1
              }
            },
            axisTick: {
              show: false
            },
            splitLine: {
              show: false,
              length: FontChart(25),
              lineStyle: {
                color: 'rgba(242, 100, 57, 1)',
                width: 2,
                type: 'solid',
              },
            },
            axisLabel: {
              show: false
            },
          },
        ]
      }
      myChart.clear()
      myChart.resize()
      myChart.setOption(option)
    },
  }
}
</script>

<style lang="scss" scoped>
.echarts1 {
  position: relative;
  width: 100%;
  height: calc(100% - 10px);
}
</style>