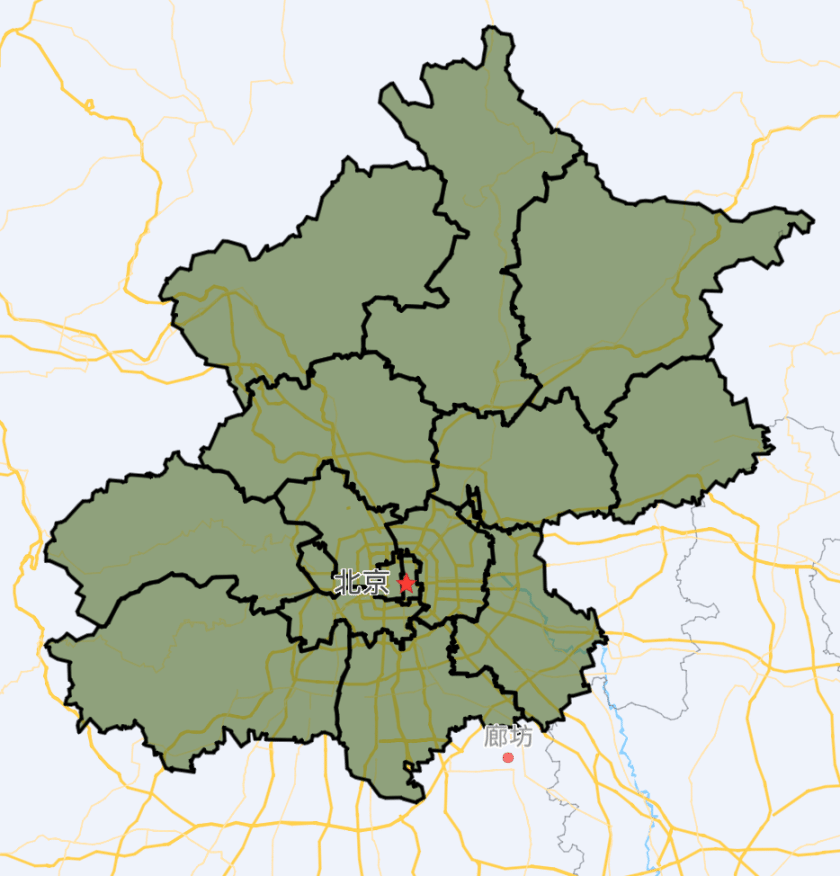
数据可视化大屏 项目开发中,客户想要要将当前市区的轮廓渲染在百度地图上,并且将下辖的区域轮廓也渲染出来。这里需要用到geoJson文件了。
geoJson文件获取
这里我们可以在阿里云平台获取:
也可以在我之前整理的文件中下载:中国地图geoJson渲染效果实例
首先引入百度地图
ak获取请查看:vue项目中使用百度地图js生成地图
<script src="//api.map.baidu.com/api?type=webgl&v=1.0&ak=your ak"></script>
官方文档实例
geoJsonLayer官方文档介绍
引入文件
引入我们下载好的geoJson文件
import geojson from './data.json'
渲染轮廓
function popup(e) {
if (e.features && e.features.length>0) {
  var overlay = e.features[0];
  if (overlay.layerName === 'bj-child') {
    // 重置数据的样式
    resetGeoLayer();
    if(overlay.toString() === 'Polygon') {
      overlay.setFillColor('yellow');
    }
    if(overlay.toString() === 'Polyline') {
      overlay.setStrokeColor('yellow');
    }

    label.setPosition(e.latLng);
    label.setContent(`<h4 style='margin:0 0 5px 0;'>${overlay.properties.name}</h4>
<p style='margin:0;line-height:1.5;font-size:13px;text-indent:2em'>
adcode:${overlay.properties.adcode}
</p></div>`);
    that.map.addOverlay(label);
  }
}
}

var bjRegionLayer = new BMapGL.GeoJSONLayer('bj-child',{
reference: 'GCJ02',
dataSource: that.geojson,
level: -10,
polygonStyle: function(properties){
  var index = properties.join || 0;
  return {
    fillColor: colorBand[index]
  }
},
polylineStyle: function(properties){
  return {
    strokeColor: 'blue'
  }
},
markerStyle: function(properties){
  return {

  }
}
});
bjRegionLayer.addEventListener('click',function(e){
if(e.features){
  popup(e);

}else{
  resetGeoLayer();
  that.map.removeOverlay(label);

}
});
that.map.addGeoJSONLayer(bjRegionLayer);
演示地址
当前效果实例下载
项目基于vue2 webpack js nodejs 16开发